13 product led growth metrics SaaS companies track in 2023

Active users, churn rate, and monthly recurring revenue (MRR) are just a few of product led growth marketing metrics every SaaS business must track.
Why?
These metrics aren’t just numbers, they’re beacons directing your business course. They underpin strategies. They shout out strengths, whisper weaknesses. They guide decisions boosting b2c and b2b growth marketing performance.
Curious about the rest metrics to track in your growth marketing analytics? Dive into this article.
Discover the entire list of led metrics SaaS companies measure 👇
What are product-led growth metrics?
Product-Led Growth (PLG) metrics are key performance indicators (KPIs) tied directly to the product’s usage and the value users derive from it.
When we mention product-led metrics or PLG metrics, we’re referring to variables such as active users, churn rates, monthly recurring revenue (MRR), and more.
Tracking these metrics is crystalline important for SaaS companies.
Why?
This product metrics framework provide crucial insight into product adoption, customer satisfaction, and revops patterns. By monitoring these metrics, SaaS companies can pinpoint their product’s strengths and weaknesses, predict customer behavior, and make informed decisions about their business strategy. Ultimately, these metrics act as a compass guiding SaaS companies toward sustained, product-led growth.
Tracking PLG metrics is indeed impossible without the Product-Led Growth (PLG) Flywheel. What is it? Continue reading to find out 👇
The Product-Led Growth Flywheel
The Product-Led Growth (PLG) Flywheel, as articulated by Userpilot is a holistic and iterative approach to driving business growth. As opposed to the traditional funnel, where the journey ends with converting prospects into customers, the Flywheel, however, focuses on a cyclical customer led growth journey.
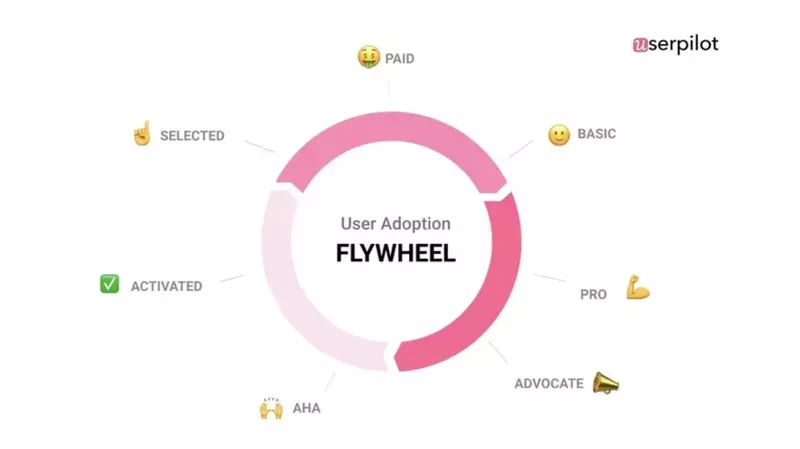
Aha!
The ‘Aha! ’ stage occurs when users understand the value of your product-led solution. It’s the moment when they realize how your product-led business can solve their problem or fulfill their need. For instance, in a music streaming application, the ‘Aha! ’ moment might be when a user finds their favorite song or customizes their first playlist.
Read more: What is the difference between demand generation vs growth marketing
Activated
The ‘Activated’ stage happens when users regularly engage with your product-led offer after the ‘Aha! ’ moment. Their regular interaction signifies their satisfaction and the value they see in the product.
Selected
During the ‘Selected’ phase, users decide to use your product led service over competing solutions. This could be prompted by unique product features, better user experience, competitive pricing, or superior customer support. It’s a pivotal point where the user makes a commitment to your product.
Paid
The ‘Paid’ stage is when users upgrade from a possible free or trial version to a paid plan. This signifies they perceive the product as valuable enough to pay for its led services and wish to continue using it despite the attached cost.
Basic
The ‘Basic’ stage indicates users are now regularly engaging with your product’s fundamental features. They have moved beyond the initial setup and exploration phase and are now using your product as a part of their routine tasks.
Pro
The ‘Pro’ stage represents higher user engagement or product use. Users at this stage are typically maximizing the product’s value by leveraging advanced features, adding integrations, or even guiding other users. They are business growth experts who make the most of what the product offers.
Advocate
The ‘Advocate’ stage is when users become ambassadors for your product. Happy with their user experience and the value they’ve derived, these users actively promote your product, offering positive reviews, referrals, and testimonials. Their advocacy can significantly influence other potential customers, creating a virtuous cycle of growth loops.
Why flywheel is a must for tracking your product growth
The Product-Led Growth (PLG) Flywheel doesn’t just depict the customer journey — it actually aids in defining and tracking the very PLG metrics that drive your business.
Each stage of the Flywheel corresponds to various metrics. For instance, the Acquisition stage is aligned with metrics like visitor-to-signup conversion rate, while the Activation phase concerns early user engagement metrics on different channels. For example, the result of your SaaS growth hacks Facebook activities.
The Flywheel corresponds to various metrics for each stage. These metrics help orchestrate and streamline the activities that contribute to PLG. In this way, the Flywheel serves as a roadmap, guiding what metrics are crucial at each stage. By defining and tracking these metrics, businesses can ensure they are focused on the right areas, thus driving sustained, product-led growth.
As we delve further into measuring product-led growth, let’s introduce the Pirate Metrics Framework, a model that fits perfectly into our product-led growth discussion. So, hang tight as we embark on the next crucial leg of our product-led growth journey 👇
How to measure product-led growth using the pirate metrics framework?
Measuring product-led growth involves a transformative approach, and that’s where the Pirate Metrics Framework steps in. Coined by Dave McClure, this framework breaks down product-led growth into five key stages — Acquisition, Activation, Retention, Revenue, and Referral or AARRR, as pirates might say!
When it comes to the AARRR framework, the journey towards product-led growth is marked by probing metrics at every stage:
- Acquisition: Here we’re looking at metrics that monitor your product visibility and how users find you. Metrics like website traffic, number of signups or downloads, and growth rate, give you insight into your acquisition strategy’s effectiveness.
- Activation: The key is early user engagement. Track metrics such as user login frequency, feature adoption rates, or time to first key action. These form a clear picture of how quickly users find value in your product-led offer.
- Retention: This phase involves monitoring the rate at which users keep coming back. Metrics like daily active users (DAUs), monthly active users (MAUs), or churn rate help gauge customer retention and the ongoing value your product-led strategy delivers.
- Revenue: We move to critical financial metrics like customer lifetime value (LTV), monthly recurring revenue (MRR), yearly recurring revenue (ARR), or conversion rates from free to paid users.
- Referral: Last, but certainly not least, we examine metrics such as Net Promoter Score (NPS), referral rates, or customer reviews and testimonials. These provide an overview of how satisfied customers are advocating for your product-led offering.
Put simply, each stage of AARRR has pertinent metrics. Tracking these systematically enables businesses to measure and optimize product-led growth strategy effectively.
Want more? Here is a free growth marketing strategy template.
Sailing onto the next key segment of our exploration, let’s deep-dive into the specific metrics that are vital for effective product-led growth.
13 metrics to measure product-led growth
1. Product Qualified Leads (PQLs)
PQLs are users who have used your product and reached a certain level of activity indicating a high level of interest.
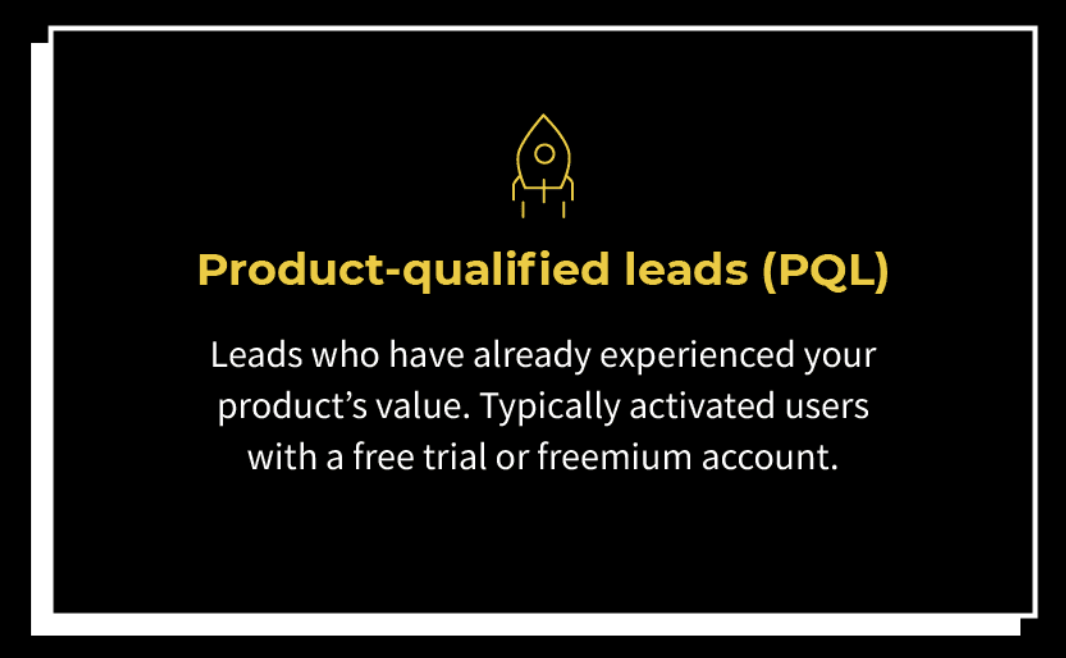
PQLs = (Number of users meeting certain activity thresholds) / (Total users)
Goal: Increase PQLs to boost sales productivity.
Example: A SaaS company might mark users who have completed an on-site tutorial as PQLs. If 50 out of 200 users did so, PQL = 50/200 = 25%.
Tool:
- Dashly lead qualification chatbots and popups,
- HubSpot,
- Intercom
Thanks! Here’s your free guide on lead qualification
2. Customer Acquisition Cost (CAC)
CAC calculates the average expense of acquiring a new customer, including marketing and sales costs.
CAC = (Cost of sales and marketing) / (Number of customers acquired)
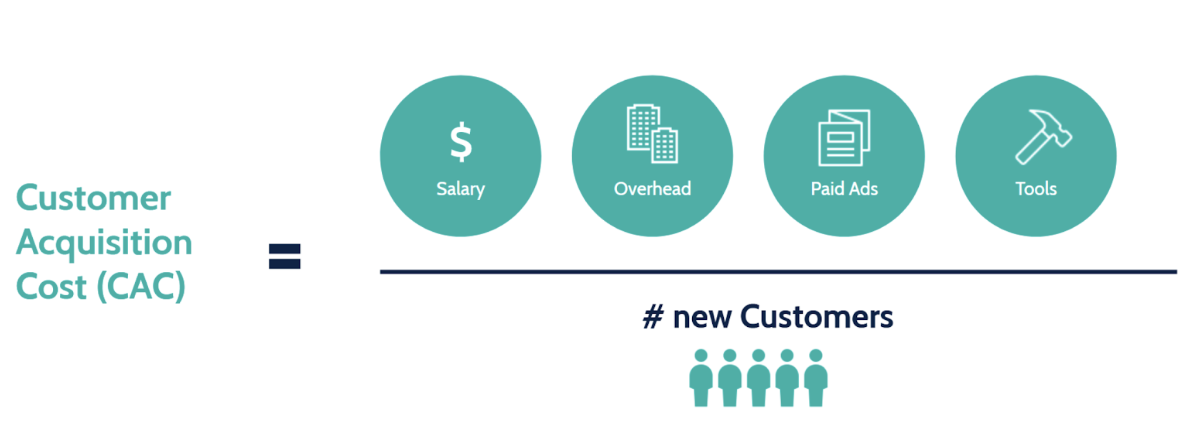
Goal: Reduce CAC while growing the number of customers to improve profitability.
Example: If a company spends 1000/10 = $100.
Tool:
- Dashly,
- HubSpot,
- Google Ads
3. Time to Value (TTV)
TTV is the duration it takes a new user to realize value from your product. It is calculated from the point of signup to the first meaningful action.
Goal: Shorten TTV for better user experience and higher conversions.
Example: If a SaaS company tracks the time it takes for a new user to create a project within their tool, that duration would constitute TTV.
Tool:
- Kissmetrics,
- Amplitude
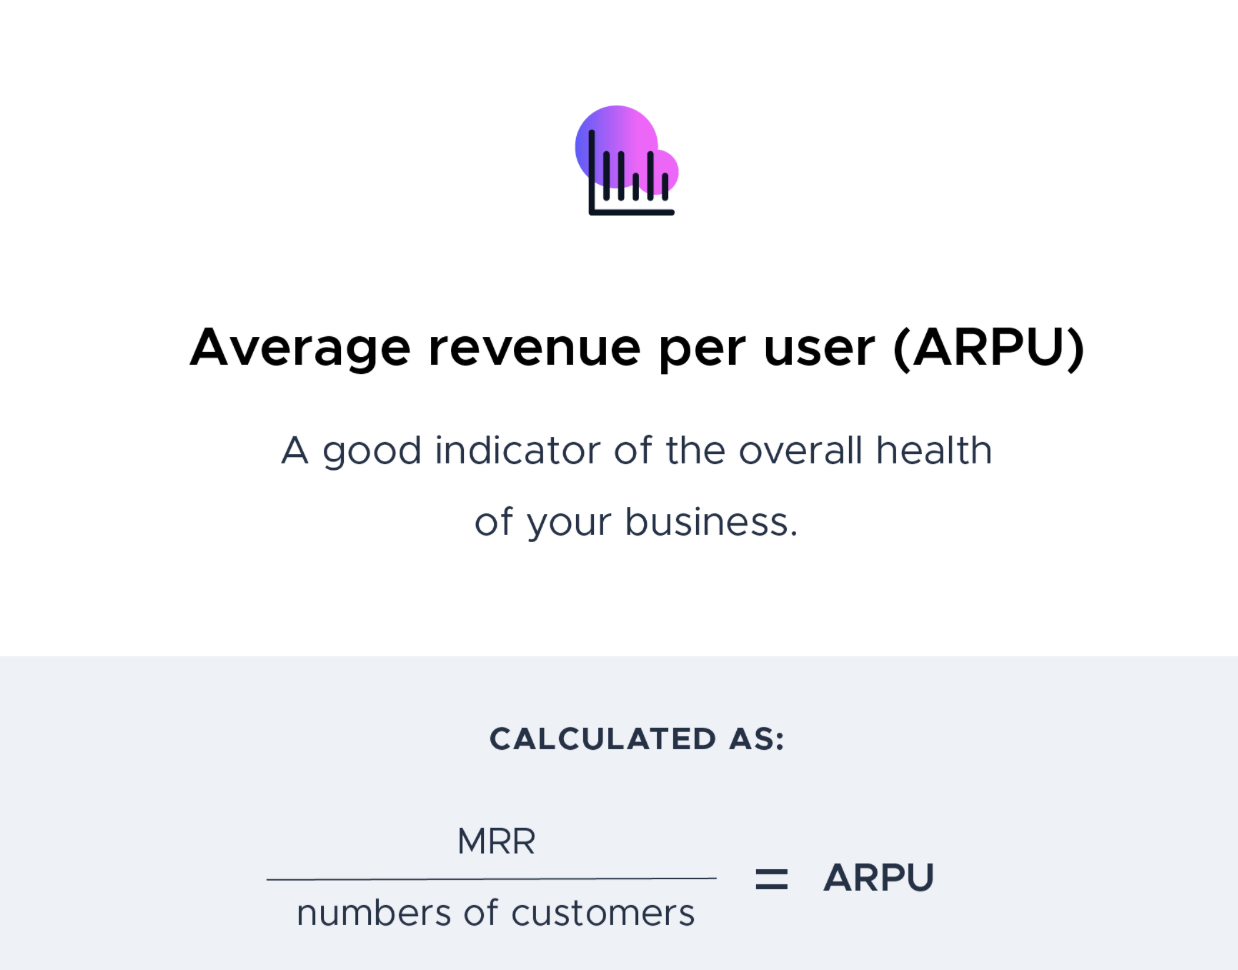
4. Average Revenue Per User (ARPU)
ARPU is the average revenue generated per user or account over a specific period.
ARPU = (Total revenue in a given period) / (Total users in the same period)
Goal: Increase ARPU through upselling, cross-selling, or raising prices.
Example: A SaaS company with a total revenue of 50.
Tool:
- Google Analytics,
- ChartMogul
5. Customer Lifetime Value (CLTV)
In simple terms, it is the amount you pay to attract new customers. For example, if your customer acquisition cost is $50 and his LTV is $200, you’re basically making $150. So, we see that the smaller the CAC metric the bigger the LTV metric. And the faster you can grow your SaaS business.
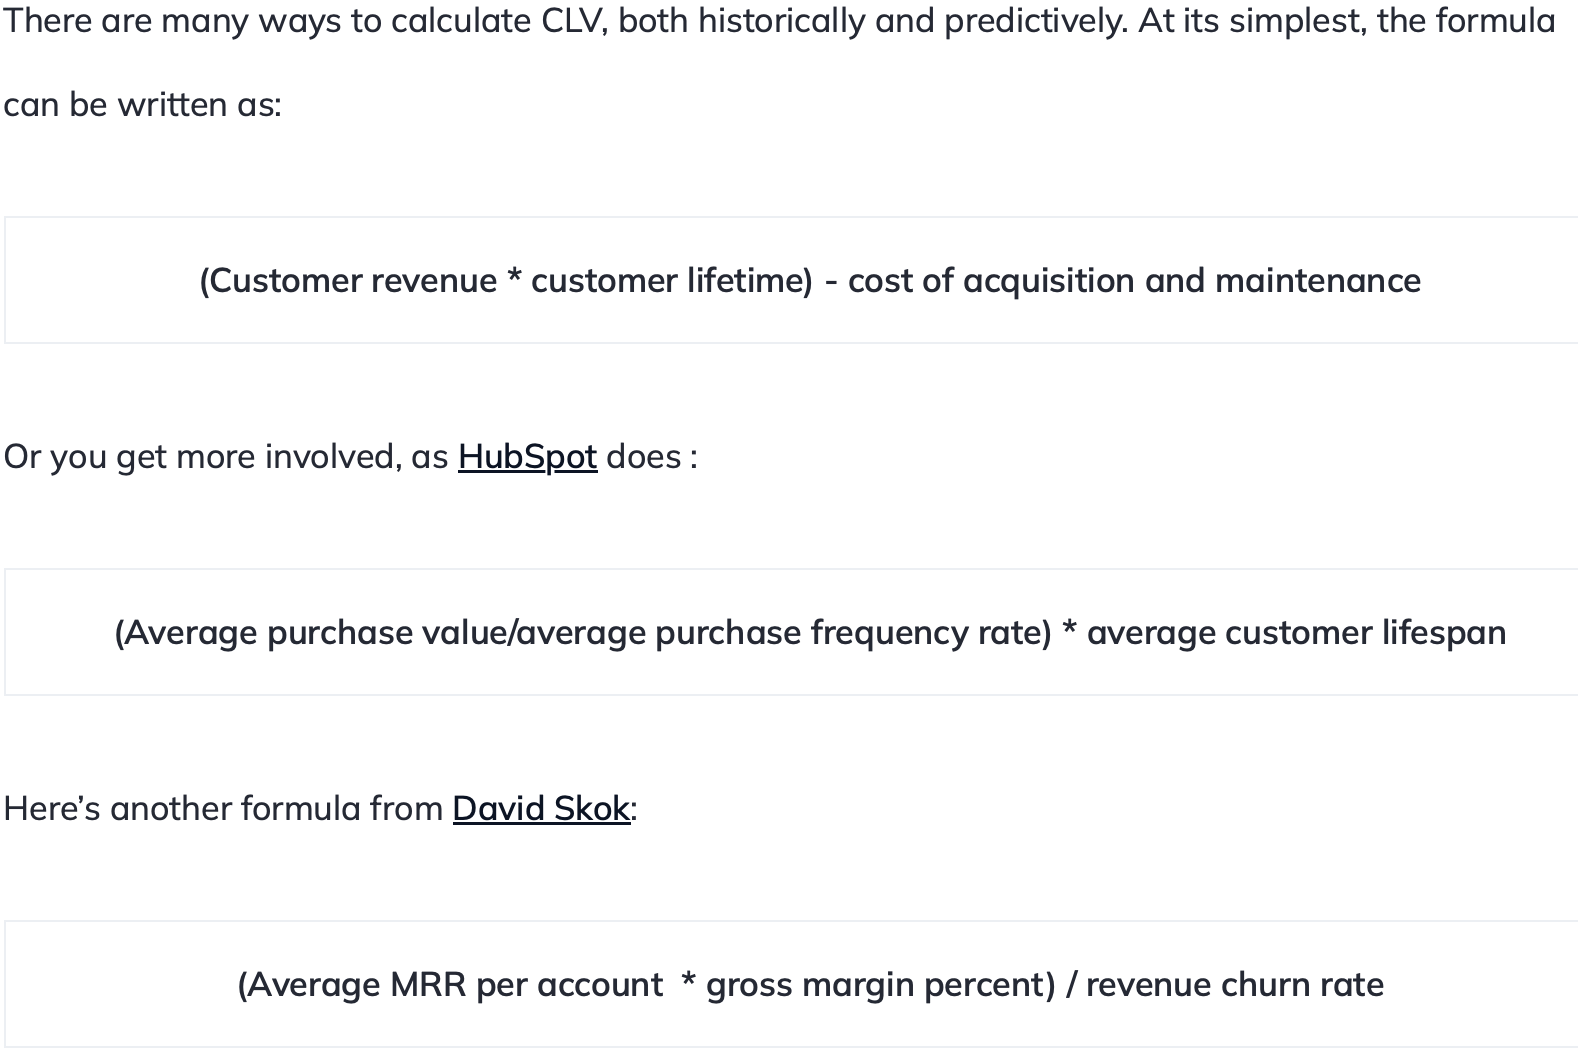
Here’s the formula we in Dashly use:
CLTV = (Average purchase value x Average purchase frequency rate) x Average customer lifespan
Goal: Boost CLTV by increasing customer loyalty and purchase volume.
Example: If a customer, on average, spends 50×12×3 = $1800.
Tool: Kissmetrics, Looker
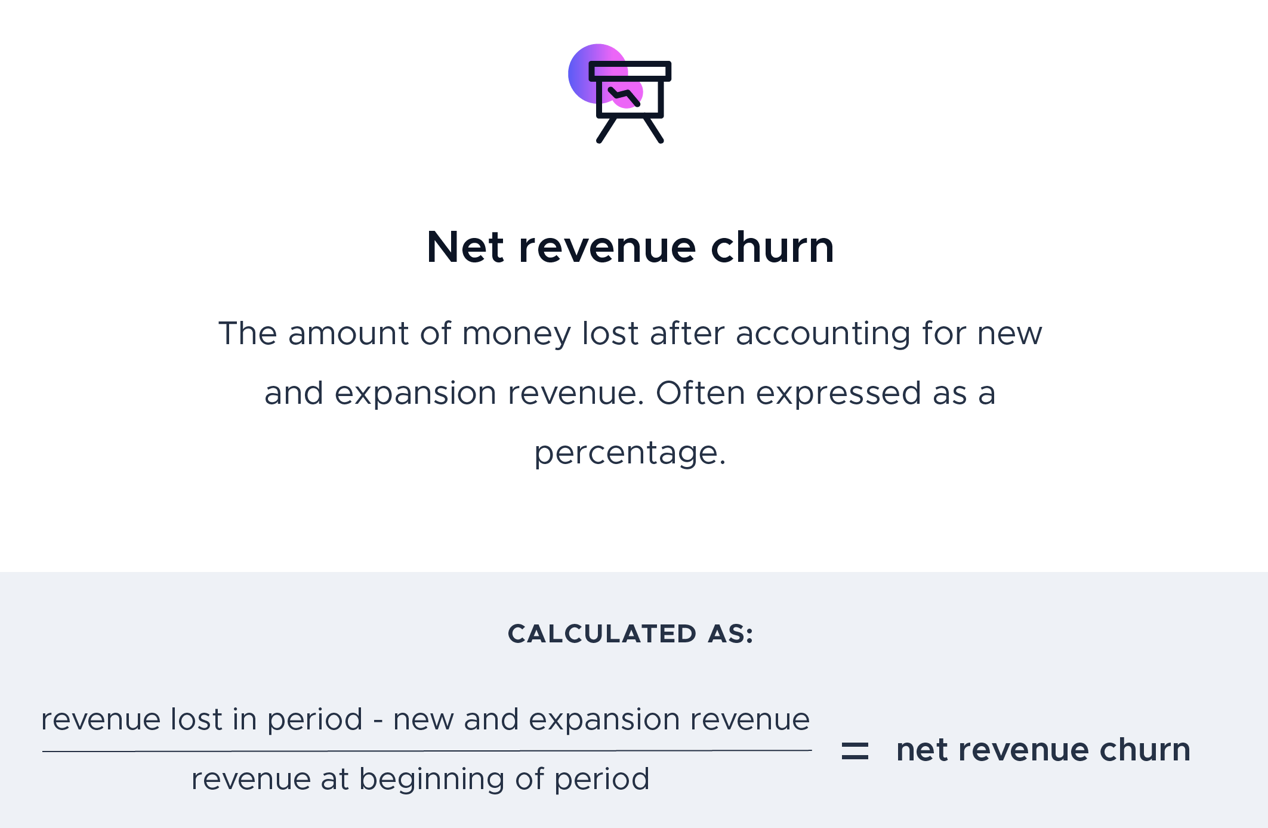
6. Net Churn
Net churn is the percentage of customers lost minus the percentage of revenue gained from existing customers over a certain period.
Net Churn = (Churned MRR — Expansion MRR) / (MRR at start of period) x 100%
Metric Goal: Keep net churn as low as possible, ideally below zero when expansion MRR exceeds churned MRR.
Example:
The better strategy is to check the churn rate over a certain period of time.
In Dashly, we do this monthly and annually. Using this strategy, you’ll better understand the main drivers of churn and work on its reduction better. This strategy will also help you work on other metrics and prioritize accordingly. Do it this way:
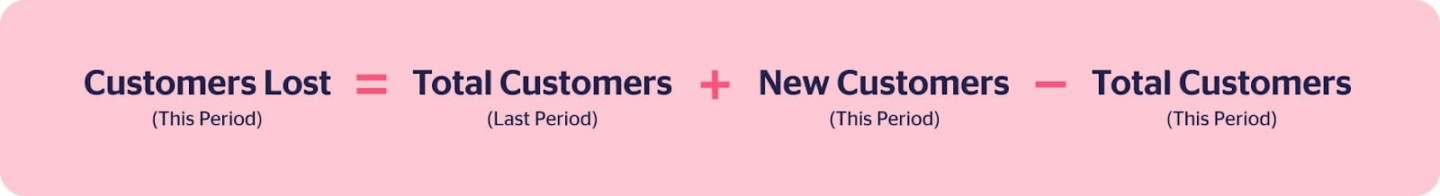
Let us make it clear using a specific example. Imagine you had 100 users last month. This month you have 125 users. 30 of them are new users.
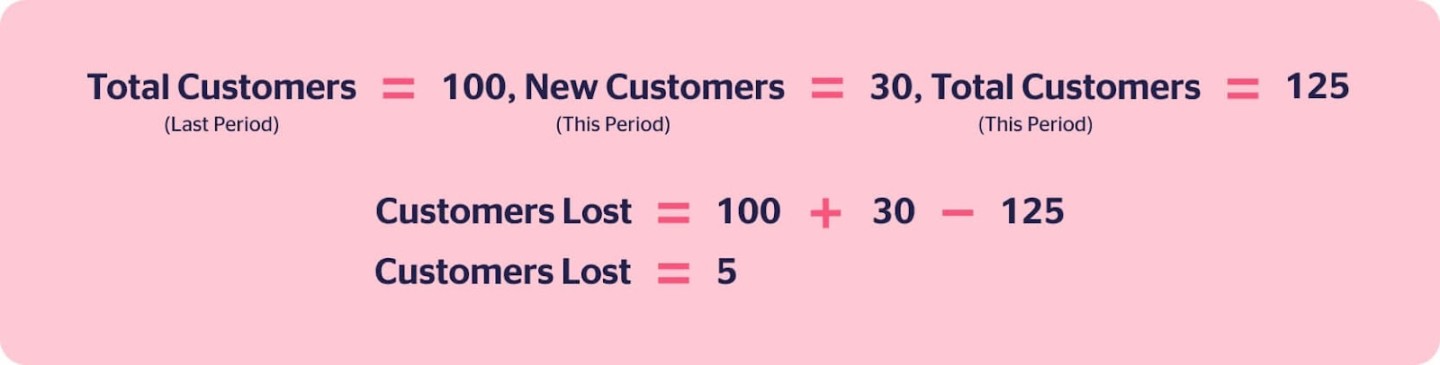
Even though the user base has increased from 100 to 125, the user reduction is 5. This reduction is your churn rate for the period.
Note: the number of users reduction may be faced during the growth. Actually your growth is the difference between acquisition rate and churn rate. This is why churn reduction affects the revenue. So, you should pay attention to the churn rate when developing your product strategy.
So if we continue playing with the above-mentioned numbers, the users reduction — or the churn rate — looks like this:

That’s it! Easy. Now when you face the churn rate, it’s time to get to know other important things for your strategy development metrics. These are interconnected with churn.
Tool: ChartMogul, Baremetrics
Pro tip on how to descrease churn rate:
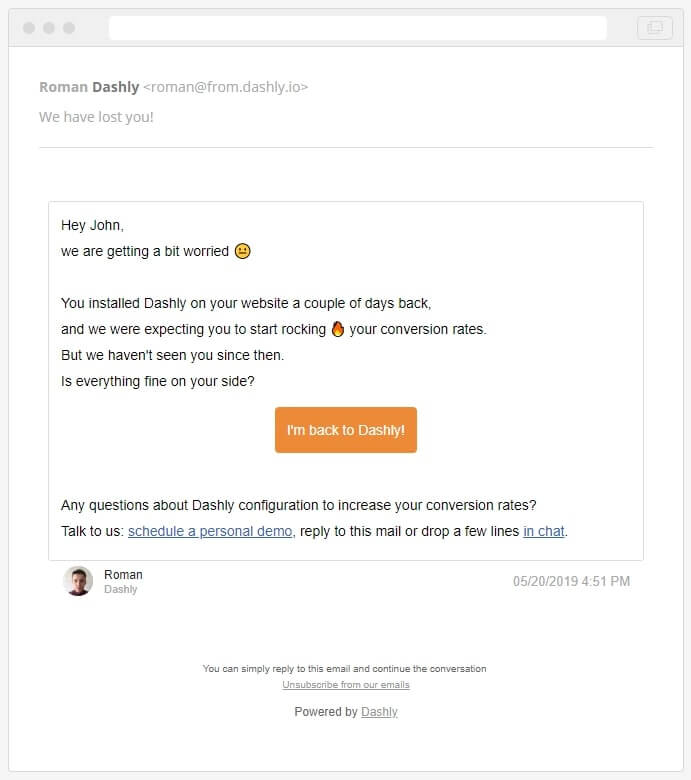
If a user hasn’t been back to you for more than two days, isn’t it time to ring the alarm?
Now the main goal of your strategy is to prevent your customers from abandoning your product. Retention emails can help you with the churn rate reduction. They are one of the simplest drivers that will make your user remember about you.
You can make this using Dashly. Go to the “Triggered messages” section, push “Create message,” choose the template or form the content of the message by yourselves — with a CTA, of course:
Then, set events “Session started” (defining that a user has started using the product), “Page visit” and “Product is activated.” These events will help you to define users who show early signs of churn.

7. Free Trial Conversion Rate
This is the percentage of free/trial users who become paid users.
Free Trial Conversion Rate = (Number of users converting from free trial to paid) / (Total number of free trial users) x 100%
Goal: Improve the rate at which free trial users convert to paid users.
Example: If 50 out of 500 free trial users upgrade to a paid plan, the free trial conversion rate is 50/500×100% = 10%.
Tool:
- Dashly,
- Google Analytics,
- Mixpanel
Pro tip on how to improve free trial metric:
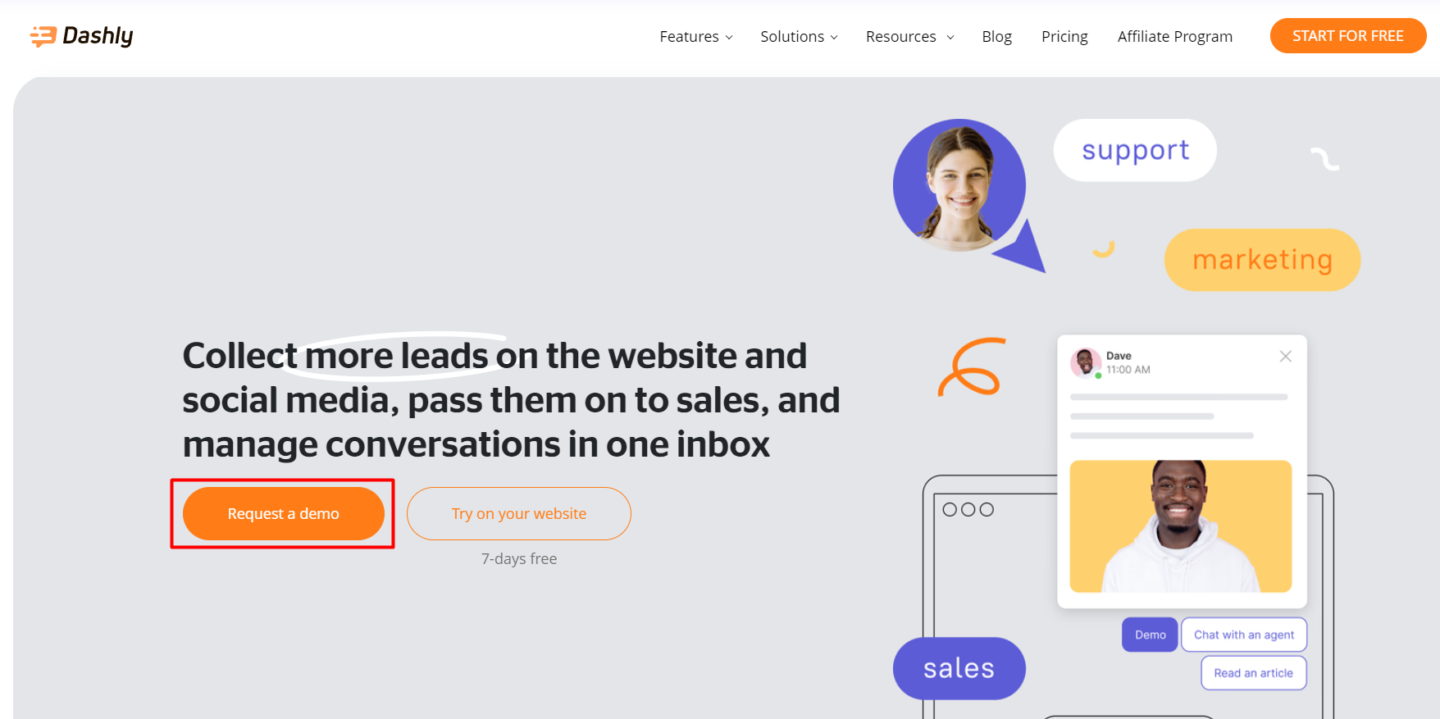
The best freemium strategy is to add the free trial banner to the pricing page — this is what target users visit most frequently. Also, you can add it to the header and other important landing pages.
Read also: Best growth marketing books that inspire Dashly Team
7. Free Trial Conversion Rate
This is the percentage of free/trial users who become paid users.
Free Trial Conversion Rate = (Number of users converting from free trial to paid) / (Total number of free trial users) x 100%
Goal: Improve the rate at which free trial users convert to paid users.
Example: If 50 out of 500 free trial users upgrade to a paid plan, the free trial conversion rate is 50/500×100% = 10%.
Tool:
- Dashly,
- Google Analytics,
- Mixpanel
Pro tip on how to improve free trial metric:
The best freemium strategy is to add the free trial banner to the pricing page — this is what target users visit most frequently. Also, you can add it to the header and some other important landing pages. Here’s an example:
But users may ignore your long form. To drive users’ attention to your free trial, try a chatbot. See how you can offer users to try your service in an interactive way:
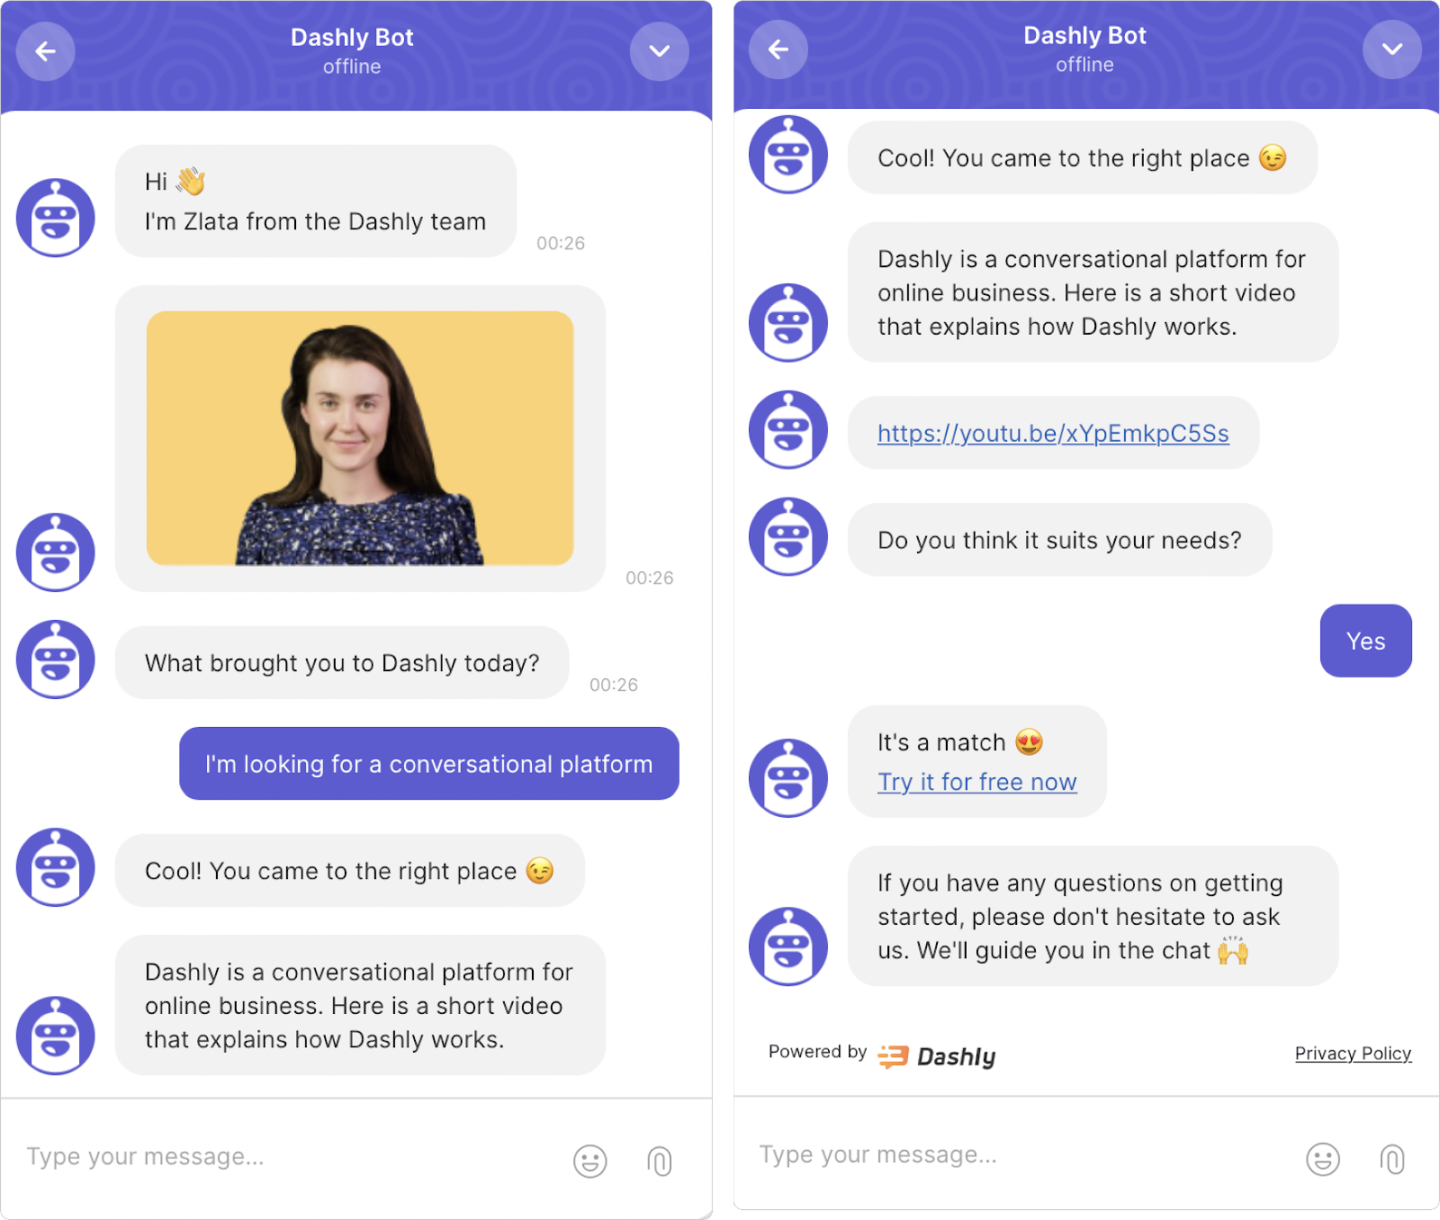
By the way, it is full of growth marketing tools your team will love. Sign up for free 😉 No credit card required.
One of the great marketing tactics is to trigger a chatbot with exit intent. This way, you can catch users’ attention when they’re about to go.
8. Expansion Revenue
This metric tracks additional revenue from existing customers through upsells, cross-sells, or add-ons.
Expansion Revenue = New MRR from upsells or cross-sells
Metric Goal: Boost expansion revenue to increase the overall MRR.
Example: A SaaS company upsells a feature for an extra 2000 to their expansion MRR.
Tool: ProfitWell, ChartMogul
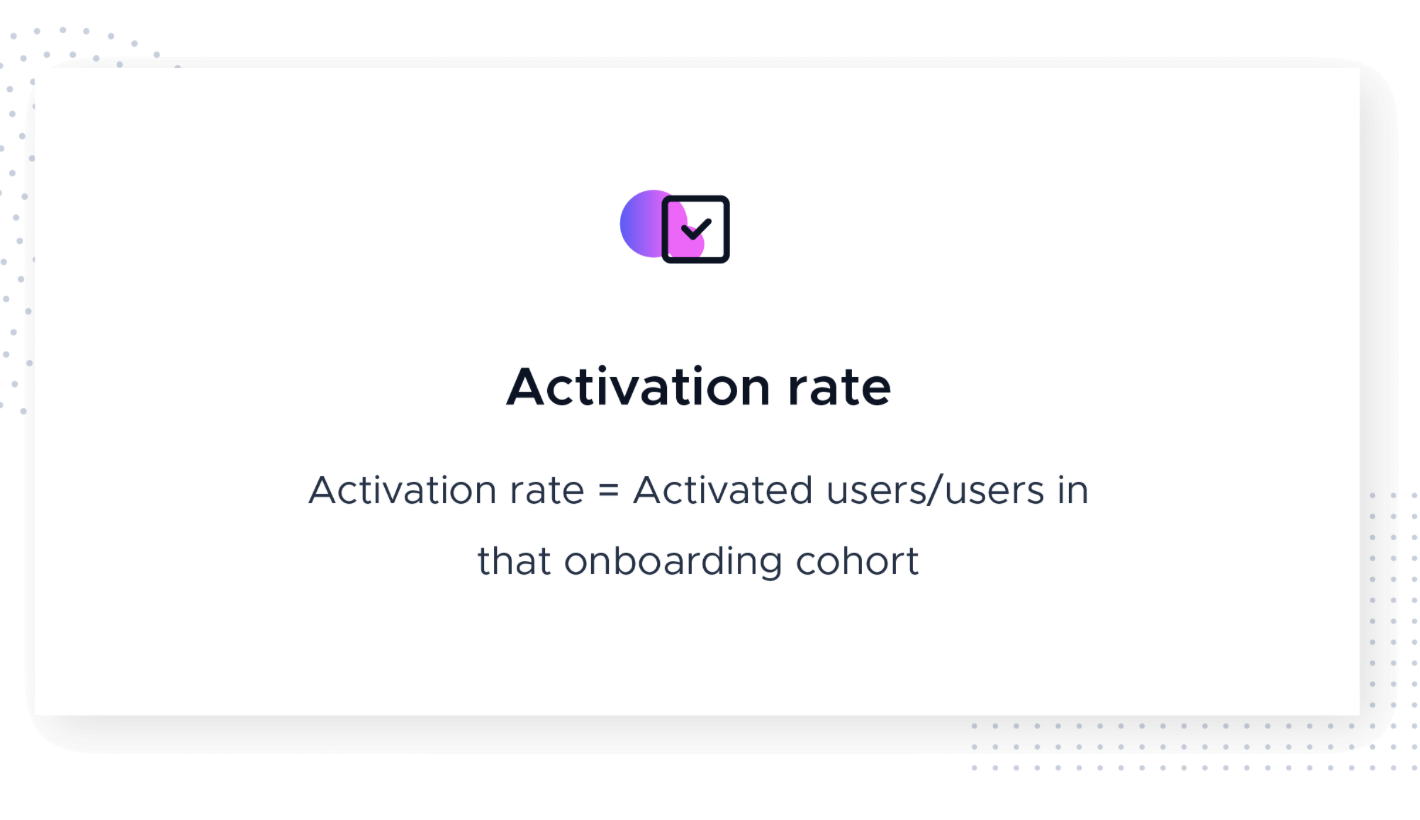
9. Activation Rate
This is the percentage of users who take a desired action within a certain timeframe after signup.
Activation Rate = (Number of users accomplishing key action) / (Number of new users) x 100%
Metric Goal: Improve the activation rate to encourage users to see value in your product and continue using it.
Example: If 70 out of 100 new users in a project management tool create a project within one day of signup, the activation rate will be 70%.
Tool: Dashly, Amplitude, Google Analytics
10. Product Virality and Network Effects
These metrics measure the extent to which your product is shared or recommended by users. A common way to measure virality is with the Viral Coefficient, calculated by multiplying the number of invitations each user sends out by the conversion rate of those invitations.
Metric Goal: Increase product virality to generate more user acquisition through word of mouth and network effects.
Example: If a SaaS platform allows users to invite friends to join, and on average, a user invites 3 friends, with 1 accepting the invitation, the viral coefficient is 3 x (1/3) = 1.
Tool: Google Analytics, Viral-Loops
11. User Feedback about your product
User feedback is qualitative information provided by users about their experience with your product. It can be measured using a scale or open-ended responses.
Metric Goal: Gather and utilize user feedback to improve the product and user experience, thereby increasing user satisfaction.
Example: A SaaS company might use customer surveys or in-app feedback widgets to collect user thoughts and opinions on features, usability, and more.
Tool: Dashly, SurveyMonkey, UserVoice
With Dashly, you can automate feedback collection and make it more interactive with a chatbot 👇

12. Feature Adoption Rate
Feature adoption rate is a measurement of how many users are utilizing a new feature. It’s calculated by dividing the number of users who have used the new feature by the total number of active users.
Metric Goal: Increase the feature adoption rate to ensure users are deriving maximum value from your product.
Example: If a SaaS company launches a new feature and 150 out of their 500 active users start using it, the feature adoption rate is 150/500 = 30%.
Tool: Pendo, Mixpanel
Pro tip on how to check feature adoption rate:
The main tip for churn reduction strategy is: make sure that customers know about product features. In case they don’t, it means they do not get the full value of the product. The churn rate drivers are becoming more significant, and the customer is about to leave. Create marketing triggered messages based on the events that haven’t been defined.
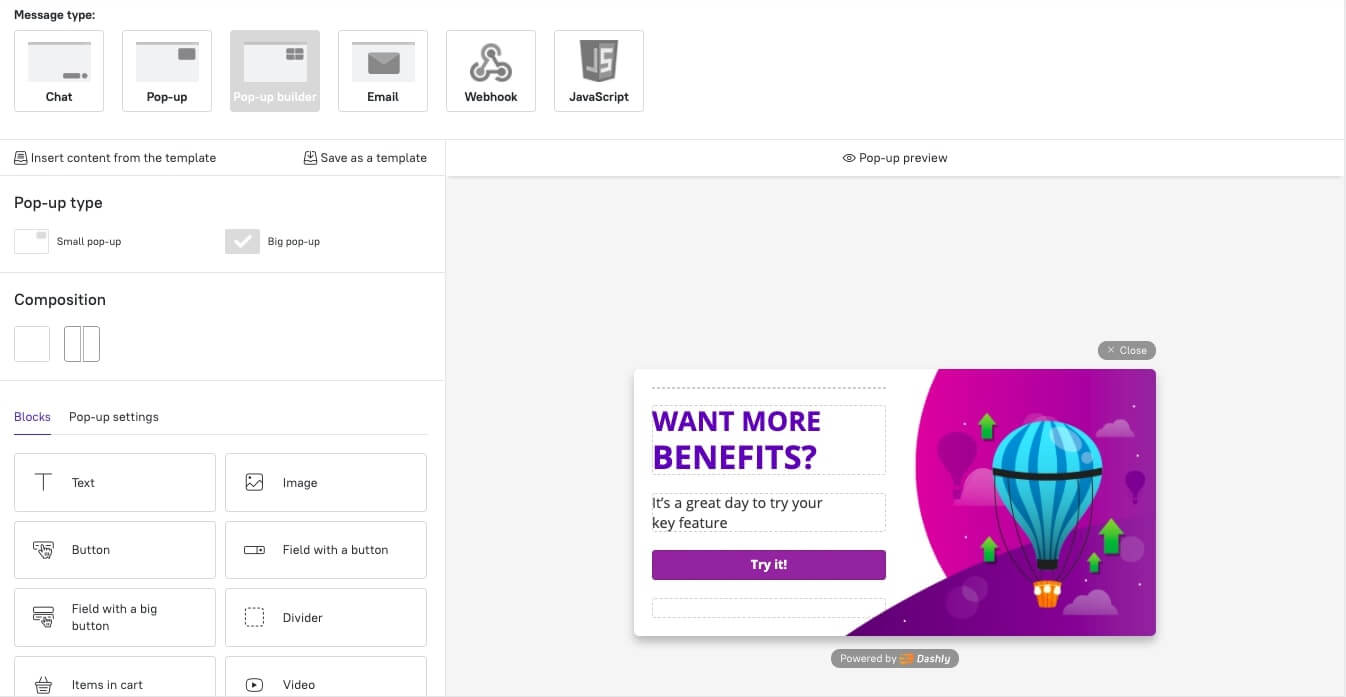
Use Dashly pop-up builder to create marketing pop-ups without developers and designers. These will be shown to a user when they are back to the product admin panel:

13. Retention Rate
Retention rate is the percentage of customers who continue to use your product over a given period.
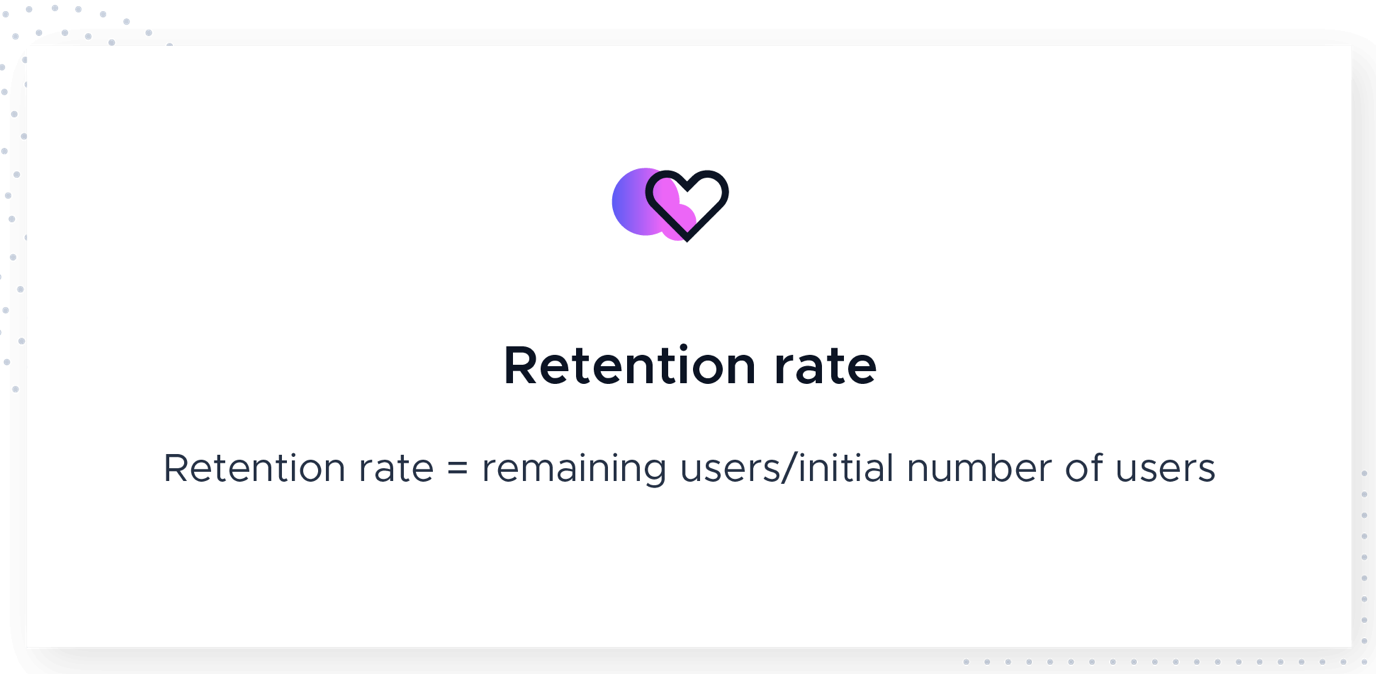
Retention Rate = ((CE-CN)/CS) x 100%
Here, CE is the number of customers at the end of the period, CN is the number of new customers acquired during that period, and CS is the number of customers at the start of the period.
Metric Goal: Increase retention rate to maintain a high customer base and revenue.
Example: If a company starts the month with 200 customers, loses 20 but gains 30, the retention rate is ((210-30)/200) x 100% = 90%.
Tool: Google Analytics, CleverTap
5 ways to improve your product-led growth metrics
So how to scale metrics you received?
- Improve Onboarding Experience: A clean, engaging onboarding process helps users understand how to navigate and benefit from your product quickly, reducing Time to Value (TTV) and boosting activation rates.
- Invest in Customer Success: Implement Customer Success strategies to help customers derive maximum value from your product. This involves proactive engagement, educational resources, and responsive support, all aimed at boosting retention and reducing churn.
- Optimize Pricing Strategy: Regularly review and optimize your pricing strategy. Experiment with different pricing tiers, packages, or value propositions to enhance your Average Revenue Per User (ARPU) and Customer Lifetime Value (CLTV).
- Encourage Referrals: Leverage happy customers to acquire new ones. Implement a referral program that rewards users for referrals, thereby enhancing product virality and lowering Customer Acquisition Costs (CAC).
- Iterate Based on Feedback: Lastly, continually gather and act on user feedback. Users often provide actionable insights which can be used to enhance features, fix bugs, and generally improve the product, thereby enhancing overall PLG metrics.
Typical challenges of measuring product-led growth performance
Measuring Product-Led Growth (PLG) metrics can prove to be quite beneficial for SaaS companies in making informed data-driven decisions. However, there are indeed challenges associated with this process:
- Data Overload: With so many metrics available, there can be an overload of data, making it confusing to determine which metrics are truly important for the business.
- Subjective Interpretation: Certain metrics, like User Feedback or even NPS, can be subjective, potentially leading to biased or inconsistent interpretations.
- Difficulties in Tracking: Depending on the product and its complexity, tracking user behavior to accurately define PLG metrics such as MAU or PQL can be challenging.
- Data Silos: Each department in a company often focuses on its own metrics, which may lead to a siloed view of the customer journey that doesn’t fully capture the PLG approach.
- Short-Term Focus: A focus on PLG metrics can sometimes lead to a short-term view, seeking instant improvements in metrics, while PLG is more about long-term sustainable growth.
Therefore, successful use of PLG metrics requires careful selection, accurate tracking, and thoughtful interpretation of the data.
The fix?
Avoiding Product-led Growth (PLG) metrics measurement issues involves a comprehensive strategy. Always outline key metrics before implementing PLG strategies. Use qualitative data to understand user behavior and tie it to quantitative results. Ensure clear communication with all growth marketing team members, remove data silos by integrating your growth marketing services, and use automation to streamline data collection. Timely and accurate metrics tracking will supply valuable insights, guide improvements, and drive customer-centered growth.
Want more inspo? Grab your free growth marketing playbook.
FAQ on product-led growth
What are PLG metrics?
Product-Led Growth (PLG) metrics are measurements that track how your users interact with your products. They highlight how these interactions fuel your business’s growth and how strategic improvements can enhance user experience. Common PLG metrics include activation rate, daily/monthly active users, churn rate, and customer acquisition cost.
Why are PLG metrics important?
PLG metrics offer insights into customer behavior and product usage trends. They allow businesses to identify improvement areas, monitor user-focused initiatives’ progress, and make decisions driven by data to facilitate customer-led growth.
How do I choose which product-led user growth metrics to measure?
Choosing PLG metrics depends on your business goals, user base, and the nature of your product. It’s crucial to focus on metrics that are directly linked to user satisfaction and product value.
What are common mistakes when measuring PLG metrics?
Common pitfalls when measuring PLG metrics include:
- focusing too much on vanity metrics,
- failing to align metrics with business goals,
- and measuring too many metrics at once.
How do I analyze product-led growth metrics efficiently?
Analyzing Product-Led Growth (PLG) metrics efficiently requires a blend of the right tools, a clear understanding of your goals, and a systematic approach:
- Choose the Right Tools: Harness data analytics and visualization tools that can represent metric data in a comprehensible and easy-to-digest format. These tools can help you track and analyze PLG metrics in real time.
- Understand Your Goals and Metrics: Define your key performance indicators (KPIs) precisely. Each business has different goals, so the metrics you need to focus on may vary.
- Regular Monitoring: Stay updated on your metrics regularly. Detect trends and patterns early on to rapidly respond to any changes or opportunities.
- Deeper Data Analysis: Go beyond surface level data. Combine quantitative data with qualitative insights for robust and comprehensive analyses.
- Team Collaboration: Engage different teams in the process of analyzing these metrics to gather diverse viewpoints and foster holistic insight.
Efficient analysis of PLG metrics leads to more informed decision-making processes, thereby driving product-led growth.
How can PLG metrics improve my business growth?
PLG metrics can significantly improve your business growth by directing you towards data-driven decisions and customer-centric strategies.
- User Acquisition Insights: Metrics such as visitor-to-signup rates can help you optimize marketing strategies, leading to more signups and potential customers.
- Boosting User Activation and Retention: By monitoring user engagement and churn rate metrics, you can identify what brings value to users, enhancing your product accordingly to increase user retention.
- Optimized Monetization: Revenue metrics like Monthly Recurring Revenue (MRR) and Customer Lifetime Value (CLV) measure the financial health of your business, allowing you to tweak pricing or upselling strategies for profit maximization.
- Enhancing Customer Advocacy: Referral metrics, such as Net Promoter Score (NPS), give insights into customer satisfaction, enabling you to turn happy customers into advocates, boosting organic business growth.
Find more benefits in the article “An ultimate guide to product led growth for your business”
Read also:
- Growth marketing vs performance marketing: what to choose for your business?
- RevOps vs Sales Ops: know the difference
- RevOps tech stack: guide to the best tools
- Revenue operations metrics: 10 metrics and KPIs to track your performance
- Growth marketing newsletter: 18 expert digests for regular insights
- PLG tools: ultimate guide to the best instruments
- Benefits of Product led growth: 12 PLG benefits for your business
- Top 10 product led growth software your competitors use in 2023
- 10 product led growth companies that boost their development right now
- Sales led growth: what is it and why your business needs it
- Growth marketing case studies: 12 stories with detailed tactics and numbers achieved
- RevOps best practices: 13 tactics to implement this year
- Growth Product Manager: Charting new frontiers in product scaling
- 20 product led growth examples to inspire your team [expert edition]
- 15 customer retention tools: find out the best software to return your customers
- Top 10 best product marketing tools for your tech stack [expert review]
- 15 best user behavior analytics tools [software features & pricing]