Unlocking exponential success: a deep dive into growth marketing analytics with Dashly experts
In a competitive business landscape, understanding how to use marketing analytics to drive superior growth is essential. Delving into growth marketing analytics provides insights into customer behavior, their preferences, and campaign performance, aligning marketing efforts with user needs for accelerated success.
Armed with this data, businesses can refine their strategies, optimizing marketing campaigns and enhancing customer experiences to boost conversions and loyalty. Analyzing robust information and measuring outcomes illuminates the path to customer led growth and profitability.
In this compact guide, we focus on five insightful reports integral to marketing analytics: acquisition, customer behavior, retention, revenue, and conversion reports. Our exploration of these reports will highlight their indispensability in building a solid growth strategy. Buckle up as we navigate towards achieving unprecedented growth!
But first –
Enjoy your free example of a growth marketing playbook with 40+ templates for successful experiments
Acquiring Knowledge Through Traffic and Acquisition Analytics
Acquisition analytics refers to capturing and analyzing how users find and interact with your product or service for the first time. For growth marketing managers in the SaaS industry, understanding this information is crucial as it allows them to identify the most effective channels for user acquisition and optimize their marketing efforts for maximum results.
The process of acquisition analytics can be broken down into the following steps:
- Identifying Acquisition Channels: This involves a comprehensive examination of all the channels through which a user can discover your product. These channels could be organic search, social media, direct traffic, referral traffic, or paid campaigns.
- Tracking User Activity: The next step involves understanding user activity across these channels. This could involve using codes in URLs or setting up goals in your analytics tool to measure how users interact with your content after entering your site through a specific channel.
- Analyzing Website Visits Data: Once user activity is tracked, it needs to be analyzed to identify patterns or trends. This involves examining your users across different channels, such as which channel drives the most website visits or which channel leads to the highest-engagement visits.
- Optimizing Marketing Efforts: Based on the data analysis, marketing managers can identify which channels are most effective and allocate their resources accordingly. They can also use this information to test and optimize their marketing efforts, improving strategies which are already working and refining those which are not delivering desirable results.
Detailed Example: SaaS Growth Marketing
As an example, let’s consider a SaaS company that has a project management tool. They utilize various channels for user acquisition, such as organic search, social media marketing, email marketing, industry webinars, and pay-per-click (PPC) advertisements.
To understand the effectiveness of these channels, the company sets up tracking codes for each one to monitor user activity. They use Google Analytics for this purpose and track product metrics framework KPIs like bounce rate, pages per session, and average session duration.
After a few months, the reports reveal that:
👉 Organic search is driving the most traffic, showing that the company’s SEO strategy is working well.
👉 Users acquired through industry webinars are spending the most time on the site and viewing the most pages per session, indicating high engagement.
👉 While PPC ads are attracting a significant number of users, the bounce rate on these users is quite high.
With this data, the SaaS company decides to invest more resources in boosting their SEO strategy and hosting more webinars, as these channels are driving website visits and engagement. At the same time, they decide to reevaluate their PPC strategy and optimize their ads to lower the bounce rate.
This example demonstrates how acquisition analytics can deepen the understanding of users and facilitate strategic marketing decisions, ultimately driving the growth of the SaaS company.
Read also: How to use growth loops for your business success strategy
Acquisition Analytics Tools
An integral part of growth marketing, Acquisition Analytics can be heavily data-driven, and multiple tools can assist business leaders in this process. Here’s an overview of some of the major tools growth marketers can use for acquisition analytics:
- Google Analytics: This is one of the most widely used tools for analyzing website and app traffic. Google Analytics can break down your website visits by sources, providing detailed information about where users come from before landing on your site. It also tracks cross-platform data, providing insights into the effectiveness of your marketing efforts across different devices.
- SEMRush: Primarily used for SEO and PPC keyword research, SEMRush also provides valuable insights on your audience, competitor’s website traffic, organic search rankings, backlinks, and more.
- Mixpanel: Mixpanel is well-suited for more precise event and user action tracking. Its strength lies in segmenting user groups and analyzing what they do across your website and app. This makes it effective for analyzing specific acquisition channels.
- Kissmetrics: Known for person-based analytics, Kissmetrics is used for analyzing full user journeys—from the first time they land on your website to when they convert to a customer. This gives you an understanding of the complete user acquisition process.
- Ahrefs: A valuable tool for checking your backlinks, Ahrefs helps analyze how much organic traffic you get from each backlink. Understanding your backlink profiles can help in sharping your SEO and traffic acquisition strategies.
- Facebook Pixel: If you are running any Facebook ads, using Facebook Pixel on your website helps immensely. It tracks user activity on your website after they’ve interacted with your Facebook ad. This information is helpful in understanding how well your Facebook ad campaigns are contributing to user acquisition.
- Hotjar: For more visual input on user interactions on your site (like heatmaps of user clicks), Hotjar fills the gap. This can be particularly beneficial for optimizing your landing pages and thereby improving user acquisition.
These tools in your marketing stack will help in collecting, categorizing, and analyzing acquisition data. The outcomes derived from acquisition analytics can then be used to make informed decisions on which channels to focus on and how to enhance your campaigns.
Read also: Growth marketing vs performance marketing.
Understanding growth marketing performance via behavior Analytics
Behavior analytics entails studying how users interact with your product or service after their initial acquisition. This data allows SaaS marketers to optimize their platform’s user experience, thereby ensuring that users not only use the product but also remain hooked.
The process of user interaction analytics includes
- Setting Up User Actions: This step involves defining what constitutes a ‘user action.’ This could be anything from clicking on a button to completing a form. It’s essential to determine which user actions are most indicative of engagement for your product.
- Tracking User Activity: Here, you employ analytics tools to track the defined user actions. Using SDK’s, tracking pixels, or third-party integrations such as heatmap platforms, session recording software or UX research tools, you can monitor how users interact with different elements of your product.
- Analyzing Behavior Data: Once user activity is tracked, the reports need to be analyzed to understand patterns and trends. This analysis can help to identify features that users are most engaged with or components that might be causing user frustration.
- Optimizing User Experience: Based on the such a report, product teams can optimize the user experience, improving features that are well-engaged and refining or eliminating elements that are proving to be hurdles in the user’s journey.
Example of analyzing customer behavior in EdTech
Let’s take the example of an EdTech start-up that has developed an innovative language learning app. The app offers interactive language lessons, tools for practicing writing and speaking, and quizzes for self-assessment. As the company wanted to expand its user base and improve user engagement, they decided to use Dashly’s website visitors’ interactions analytics and lead card for understanding user in more detail.
1️⃣ Setting up User Actions. The start-up first defined the crucial user actions to track on their website and app. This included actions like clicking on a language course, time spent on different sections, completion rate of quizzes, and frequency of practice sessions.
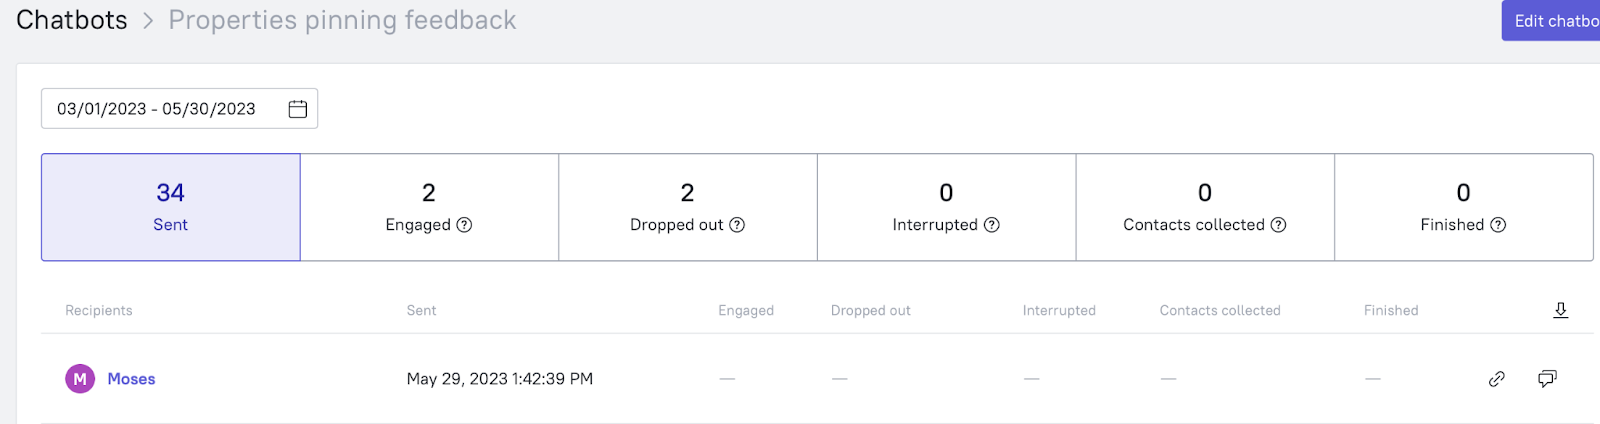
2️⃣ Analyzing User Activity with Dashly. To track these defined actions, they utilized Dashly’s behavior analytics feature. Dashly automatically tracks all actions performed by a website visitor and creates user events based on these actions.
3️⃣ Analyzing Behavior with Dashly. Once the start-up began collecting user behavior through Dashly, they started analyzing it. They found out that many users who clicked on a language course did not enroll in it. More often than not, these users browsed through several courses but did not proceed to take action.
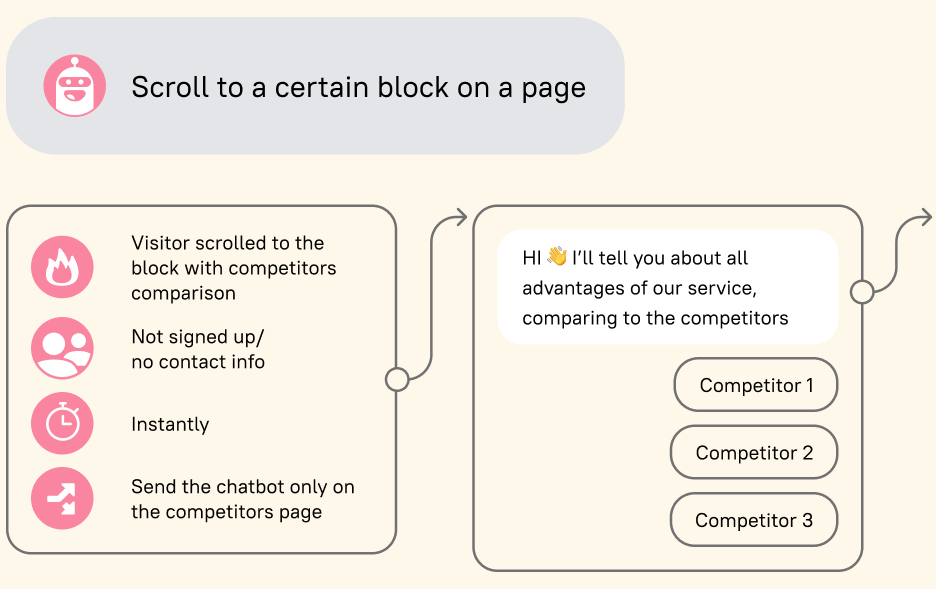
4️⃣ Utilizing Dashly’s Lead Card for Understanding User Behavioral Patterns. To gain deeper insights into this behavior pattern, the start-up used Dashly’s lead card. The lead card in Dashly is a profile card for every user that shows a detailed breakdown of their journey on the website—who they are, where they come from, what actions they performed, and their conversation history.
5️⃣ Optimizing User Experience Based on Insights. The lead card data revealed that many users who were browsing through the courses were new visitors who hadn’t signed up yet. The company concluded that these users might need more motivation or information to take the plunge.
As a result, the company decided to introduce a free trial for a few starter lessons in each language course. They also decided to display more user testimonials and course benefits on the course pages to address potential user hesitations.
After implementing these changes and monitoring the data, they noticed a significant increase in course enrolments and overall user engagement on the app.
This case demonstrates how customer analysis can provide valuable insights into how users interact with your site and where there may be scope for improvement. Dashly’s website visitors’ behavior analytics and lead card offer a detailed view of user interactions that the company can use to enhance the user experience, increase engagement, and drive growth.
Free expert insights to boost your marketing strategy and raise conversion to a target action by 10%

Behavior Analytics Tools
Analyzing user behavior can be an intricate process, as subtle as understanding the nuances of human behavior. Thankfully, there are robust tools available to assist in this cause:
- Dashly website visitors behavior tracking: Understand who you are talking to, what they need, and offer the best solution by analyzing website visitors’ behavior, their interactions with your company, and always have it at your hands in the Lead Card.
- Mixpanel: Mixpanel allows you to track user interactions with your web and mobile applications. It also enables segmentation of your user base for more in-depth analysis.
- Hotjar: Hotjar provides heatmaps and session recordings, which can give visual context to how users interact with your product.
- Amplitude: Amplitude is known for its user behavior and cohort analysis. It helps identify patterns in user behavior, which can be leveraged to enhance the user experience.
- Heap: Heap automatically captures every user action on your website or app, allowing you to measure user actions without needing to define them upfront.
These behavior analytics tools can observe, track, and analyze user activities, enabling growth marketing managers to optimize their product for a more engaging user experience.
Read also: Your Growth Marketing Strategy Template with guide and examples
Conversion analytics tracking
Conversion analytics helps in understanding how users journey through your conversion funnel — from being prospects to becoming paid users. SaaS growth marketing managers find it vital to optimize the conversion flow, ensuring that more users become paid customers.
The conversion analytics process is laid out as follows:
👉 Defining Conversion Events: A critical upfront task is to define what a ‘conversion event’ is for your product. This could be signing up for a trial, upgrading to a paid plan, or making an in-app purchase.
👉 Tracking User Conversions: With conversion events defined, the next task is analyzing these events when a user takes such an action. This could involve setting up event tracking in your analytics tool or using a dedicated conversion measurement tool.
👉 Analyzing Conversion Data: Once data on conversions start coming in, it needs to be analyzed to spot patterns or trends. Examining the conversion data can help identify stages in the user journey where users are most likely to convert or fall off.
👉 Optimizing Conversion Funnel: Based on the analysis, growth marketing managers can improve the conversion process. They can make it as frictionless as possible, ensuring users don’t drop off midway due to complicated steps or unclear instructions.
Example of conversion analytics from digital design agency growth marketers
Let’s imagine DigiDesign, a digital design agency, the primary focus is to create compelling and consummate web designs, mobile applications, and digital marketing campaigns for diverse clients.
It has just launched a new website redesign service. Despite garnering a good amount of website traffic, the conversion rate (visitors who actually placed orders) remained disappointingly low.
The fix?
The growth marketer initiatively embarked on an inspection of the agency’s first point of customer interaction—the website. The following steps were implemented:
- Setting up Conversion Goals: The growth marketer defined conversion goals on Google Analytics. These goals were actions that they hoped website visitors would complete — like filling up a form or purchasing a service.
- Tracking the User Journey: The growth marketer used a heat map (like HotJar) to have a granular view of how visitors interacted with the website. The areas where visitors spent the most time were given particular attention, and areas where visitors dropped out of the conversion funnel were identified.
- Audience Segmentation: Using segmentation, they differentiated the customers based on numerous factors— geography, age, device used, new or returning visitor etc. — to understand their behaviors better.
- A/B Testing: The growth marketer used A/B tests extensively to test different versions of webpages, call-to-action buttons, forms etc., and choose which one converts better.
A few months into these analytical endeavors, and interesting developments were being observed. The heat maps pinpointed that some users were bouncing back from the final pricing page, identifying the high pricing as a conversion hurdle. Based on this, DigiDesign revised their pricing strategy.
A/B testing showed that shorter forms converted better, so they redesigned the customer inquiry form to make it more concise.
Through audience segmentation, it was found out that a large section of the visitors were from the finance industry. Thus, creating a dedicated service page for this industry became pivotal to provide a more personalized experience.
Read also: How to use growth loops for your business success strategy
Conversion Analytics Tools
Understanding where and why users convert is essential to scaling a SaaS business. A variety of reliable conversion analytics tools are available to help in this endeavor:
- Google Analytics: It is a ubiquitous tool for analyzing user actions, such as sign-ups, form submissions, and purchases. Combined with Google Tag Manager, it can track virtually any user event, which can then be used to assess conversion rates.
- Crazy Egg: Known for its heatmaps and scroll maps, Crazy Egg also provides robust conversion tracking tools, such as A/B Testing and conversion funnel analysis, to identify where users drop off.
- Optimizely: Optimizely is a feature-rich platform that provides A/B testing and multivariate testing capabilities. It helps you understand which version of a page or feature results in better conversion rates.
Dashly triggered messages analytics. This platform offers a variety of tools like a chatbot, popups, live chat, and emails. Companies that use them have a detailed report on the lead clicks, conversion, and bounce rate.
Retention growth analysis
Retention analytics focuses on understanding user loyalty — how many users continue to use your product or service over time. For SaaS growth marketers, retention analytics provides information necessary to ensure that users remain active and satisfied with the product, leading to a consistent revenue stream and more opportunities for upselling and cross-selling.
Here’s how the process of retention analytics unfolds:
👉 Defining User Retention: To start, you need to define what ‘user retention’ means for your product. It could be logging in daily, using a specific feature every week, or staying subscribed to a paid plan every month.
👉 Tracking User Retention: After defining what user retention means for your platform, you should set up systems that monitor these specific user actions over time.
👉 Analyzing Retention Data: As you start analyzing user retention, you’ll want to continually analyze this information to understand trends in user loyalty, identify elements that keep users returning, or spot characteristics of users who churn.
👉 Optimizing User Retention: Based on the information gleaned from the retention data, growth marketing managers can implement strategies to improve user retention. This could be enhancing certain features, offering loyalty rewards, or personalizing the user experience.
Detailed Example: SaaS Growth Marketing
A SaaS business, such as a B2B CRM platform, uses retention analytics to ensure its users continue to use its services over time. They use Amplitude to track retention metrics, monitoring weekly active users, and tracking whether they use key features like contact management and email marketing automation.
Through detailed analysis, they find that users who use the contact management feature in the first week are significantly more likely to remain active users in the following months. Having this insight, they streamline the initial onboarding process to encourage new users to use this feature as early as possible.
This use case illustrates how retention analytics can help identify key indicators of user retention, informing strategies to improve user loyalty and ultimately enhance overall user retention.
Retention Analytics Tools
Retention analytics demands a well-crafted toolset. Here are a few growth marketing tools designed specifically for retention analysis:
👉 Amplitude: Known for product led growth marketing analytics, Amplitude provides in-depth retention tools and allows you to track user retention based on specific actions users take on your product.
👉 Mixpanel: Mixpanel allows you to track event-based retention and cohort-based retention, giving a solid understanding of which user group stays longer with the product and why.
👉 Clevertap: Clevertap provides robust retention analytics capabilities. It allows you to set up and track retention cohorts based on various user attributes or actions.
👉 Baremetrics: If you’re running a subscription-based SaaS, Baremetrics provides churn analysis and cohort analysis features focused specifically on subscription businesses.
Revenue marketing campaigns analytics
Revenue analytics involves understanding how different user groups, products, and marketing strategies contribute to the overall revenue. For SaaS growth marketers, revenue analytics is crucial as it directly measures the financial effectiveness of the implemented strategies.
The revenue analytics process can be mapped as follows:
- Identifying Revenue Metrics: The crucial ‘North Star’ revenue metrics for the product need to be identified. These could be Monthly Recurring Revenue (MRR), Annual Recurring Revenue (ARR), or Customer Lifetime Value (CLV).
- Tracking Revenue Metrics: Next, appropriate mechanisms are put in place to collect data on these revenue metrics regularly.
- Analyzing Revenue Data: The collected revenue data needs to be continuously analyzed to understand trends and patterns, which can provide insights into the revenue health of the business.
- Optimizing Revenue Strategies: Based on the analysis, if certain user groups or features are driving higher revenue, efforts can be made to further nurture them. Similarly, if certain strategies are not leading to expected revenue outcomes, they can be refined or replaced.
Read also:
A secret collection of growth marketing services Dashly team uses daily
Product led growth metrics: 13 key indicators for SaaS companies to track
PLG tools: ultimate guide to the best instrument
Benefits of Product led growth: 12 PLG benefits for your business
Top 10 product led growth software your competitors use in 2023
10 product led growth companies that boost their development right now
Sales led growth: what is it and why your business needs it
Example: SaaS growth marketing analytics of the revenue
Let’s image a SaaSBoost company that specifically offers a subscription-based business intelligence tool aimed at helping small businesses make data-driven decisions. They were facing challenges with user churn and stagnant growth in their monthly recurring revenue (MRR).
The sequence of actions that the growth marketer took entails:
- Defining Key Revenue Metrics: Initially, important revenue metrics were defined, like the average revenue per account (ARPA), MRR, churn, and customer acquisition cost (CAC).
- Utilizing Revenue Analytics Software: They decided to use ChartMogul, a software similar to Dashly, which focused extensively on revenue analytics for SaaS companies. ChartMogul could connect effortlessly with their billing systems and extract the necessary data for analysis.
- Analyzing Revenue Data: Data started streaming in, and the growth marketer dived into the analytics. They discovered the churn rate was significantly high among users within the first 60 to 90 days of signing up.
- Understanding User Behavior with ChartMogul’s Customer Profiles: To understand why churn was so high, they used customer profiles for deeper insights. The profiles offered a timeline of user activity and detailed subscription history.
- Optimizing Based on Insights: The profiles showed many customers had suffered from technical issues early on. Also, some users found their onboarding process overwhelming with the myriad of features the tool held.
Based on these insights, the growth marketing team decided to revamp their onboarding process, making it more user-friendly and interactive. Additionally, increased support during this crucial initial period was offered to resolve any technical issues swiftly.
Revenue Analytics Tools
Revenue analytics can make or break a SaaS business. Choosing the right tool for tracking and analyzing revenue is imperative. Here are some tools crafted for this purpose:
- ChartMogul: provides comprehensive revenue analytics, including MRR, churn rate, and customer lifetime value.
- Baremetrics: Focusing specifically on subscription businesses, Baremetrics offers insightful revenue data like MRR, ARR, net revenue, refunds, and more.
- ProfitWell: ProfitWell provides accurate and insightful financial metrics, including MRR, churn, and customer acquisition costs. It’s highly focused on helping you optimize your pricing strategy.
- Paddle: Paddle is a revenue delivery platform for SaaS that provides extensive revenue analytics and insights, helping SaaS businesses to optimize their conversion and retention strategies.
Understanding and executing these tools makes growth marketing managers strategic powerhouses. By leveraging these analytics, they can acquire more users, understand user behavior, improve conversions and retention, and optimize revenue generation.
Read also:
RevOps vs Sales Ops
Revenue operations metrics: 10 metrics and KPIs to track your performance
B2B growth marketing: accelerating business success
Demand Generation vs Growth Marketing: Where to focus?
Growth marketing newsletter: 18 expert digests for regular insights
Boost your business growth together with experienced marketers!
Dashly experts has been improving conversion rates since 2014. More than 450 successful projects and even more lessons learned.

Frequently Asked Questions
1. What is the role of marketing analytics?
Analytics is used to deliver insights about customers, their behavior, and their interactions with your product or service. It facilitates data-driven decision making, ensures resources are effectively utilized, and drives growth.
2. How do you use analytics for growth marketing?
The use of analytics involves monitoring key performance indicators (KPIs), interpreting the information collected, and using these insights to shape and refine marketing strategies for optimum business growth.
3. What tools to use to analyze marketing campaigns?
Google Analytics, Amplitude, Mixpanel, and Segment are some of the popular ones. They provide extensive analytics capabilities ranging from user behavior analysis to ROI tracking.
4. What metrics should I track?
Some crucial metrics that growth marketing managers should track include acquisition cost, conversion rates, average revenue per user, churn rate, customer lifetime value, and net promoter score.
5. How does analytics drive business growth?
Analytics drives business growth by delivering actionable insights, which help in making informed decisions. It reveals what’s working and what’s not, providing guidance for the allocation of resources, thus facilitating better business outcomes. By leveraging analytics, businesses can enhance customer satisfaction, boost sales, and fuel sustainable growth.
In a nutshell, marketing analytics is all about knowing which metrics matter the most for your business and thoroughly understanding what those numbers indicate. Adopting such an analytics-driven approach can significantly weigh in the marketer’s ability to make effective growth strategies.
Read also:
25 Growth Marketing Books to Skyrocket Success
22 SaaS growth hack Facebook tactics to boost your business
Skyrocket your company revenue with a complete guide to RevOps Revenue Operations
RevOps tech stack: guide to the best tools
Growth marketing case studies: 12 stories with detailed tactics and numbers achieved
RevOps best practices: 13 tactics to implement this year
Growth marketing framework: Battle-tested insights from Dashly experts
Growth Product Manager: Charting new frontiers in product scaling
20 product led growth examples to inspire your team [expert edition]


![The ultimate guide to growth marketing in 2025 [explained by a growth hacker]](https://www.dashly.io/blog/wp-content/uploads/2023/04/The-ultimate-guide-to-growth-marketing-explained-by-a-growth-hacker-720x317.png)
![Ultimate guide to creating a successful marketing growth strategy in 2025 [6 real-life examples]](https://www.dashly.io/blog/wp-content/uploads/2023/05/Expert-guide-to-creating-marketing-growth-strategy-6-examples-720x317.png)

