9 KPIs Metrics to Measure your Live Chat Performance
Drive sales and increase conversion at the very beginning of communication. Let customers write whenever they want — in live chat, messengers, or social networks

Part 9
Part 10
Key metrics to measure live chat efficiency
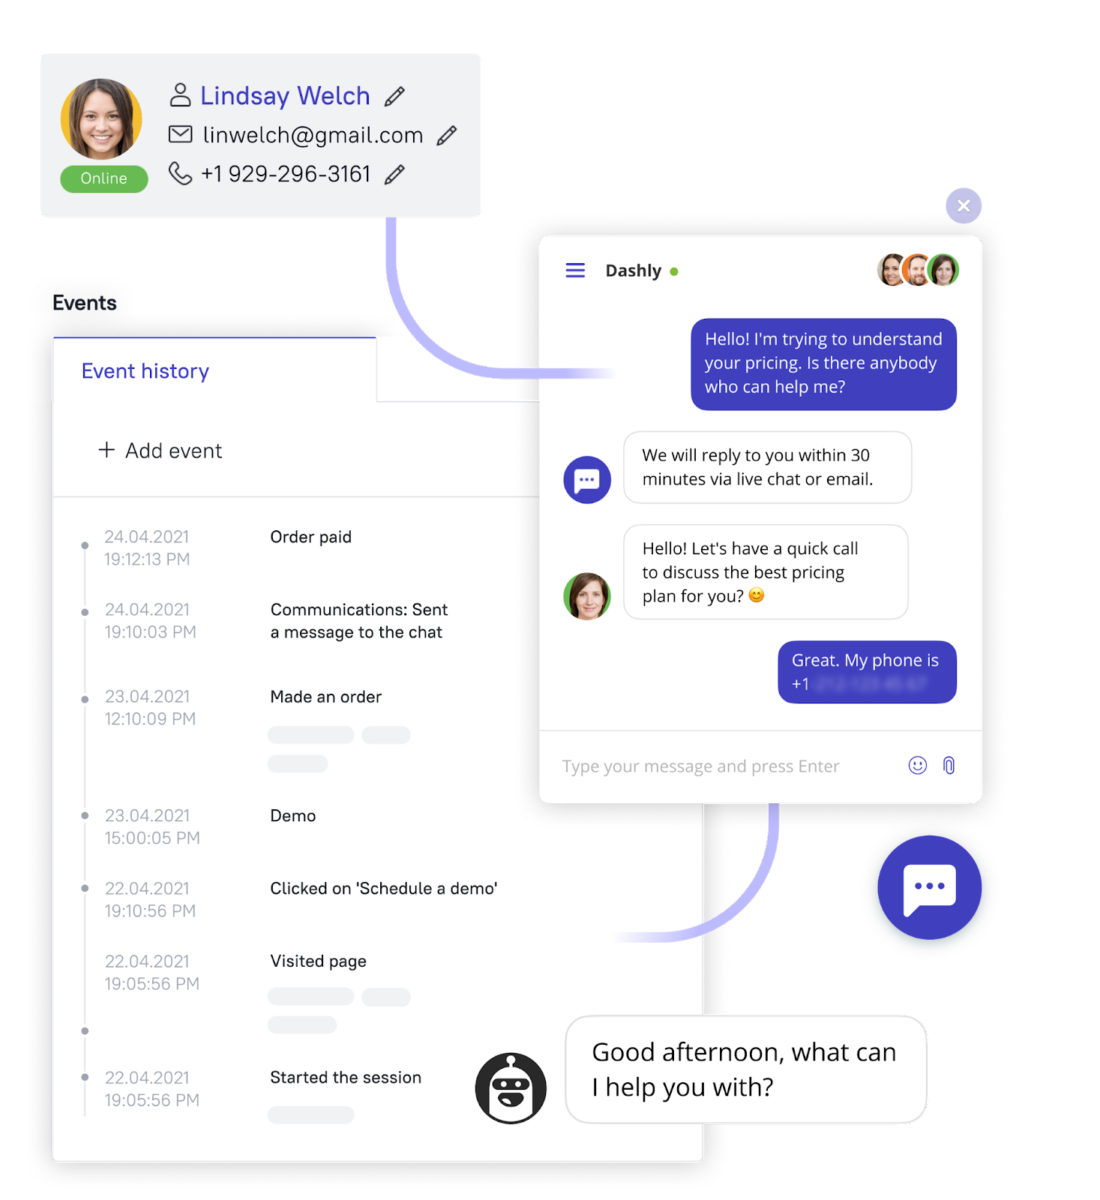
Live chat analytics is the practice of tracking and interpreting data from chat conversations to understand how well your support and sales teams perform. It tells you how fast agents respond, how often issues are resolved on the first touch, how satisfied customers leave, and how much of the workload AI agents handle automatically.
This guide covers 12 key live chat metrics grouped by category with benchmarks and Dashly examples. Thia way, so you can act on the numbers, not just collect them.
Four categories of live chat metrics
Not all metrics matter equally at every stage. Grouping them by category helps you spot where the problem is before diving into individual numbers.
| Category | What it measures | Key metrics |
|---|---|---|
| Speed | How fast your team responds | First response time, resolution time |
| Efficiency | How much volume your team handles | Chat volume, chats per agent, missed chat rate, FCR |
| Satisfaction | How customers feel | CSAT, customer effort score |
| AI and automation | What AI agents handle autonomously | Deflection rate, bot involvement rate |
Jump to any section below for benchmarks and how to improve each metric.
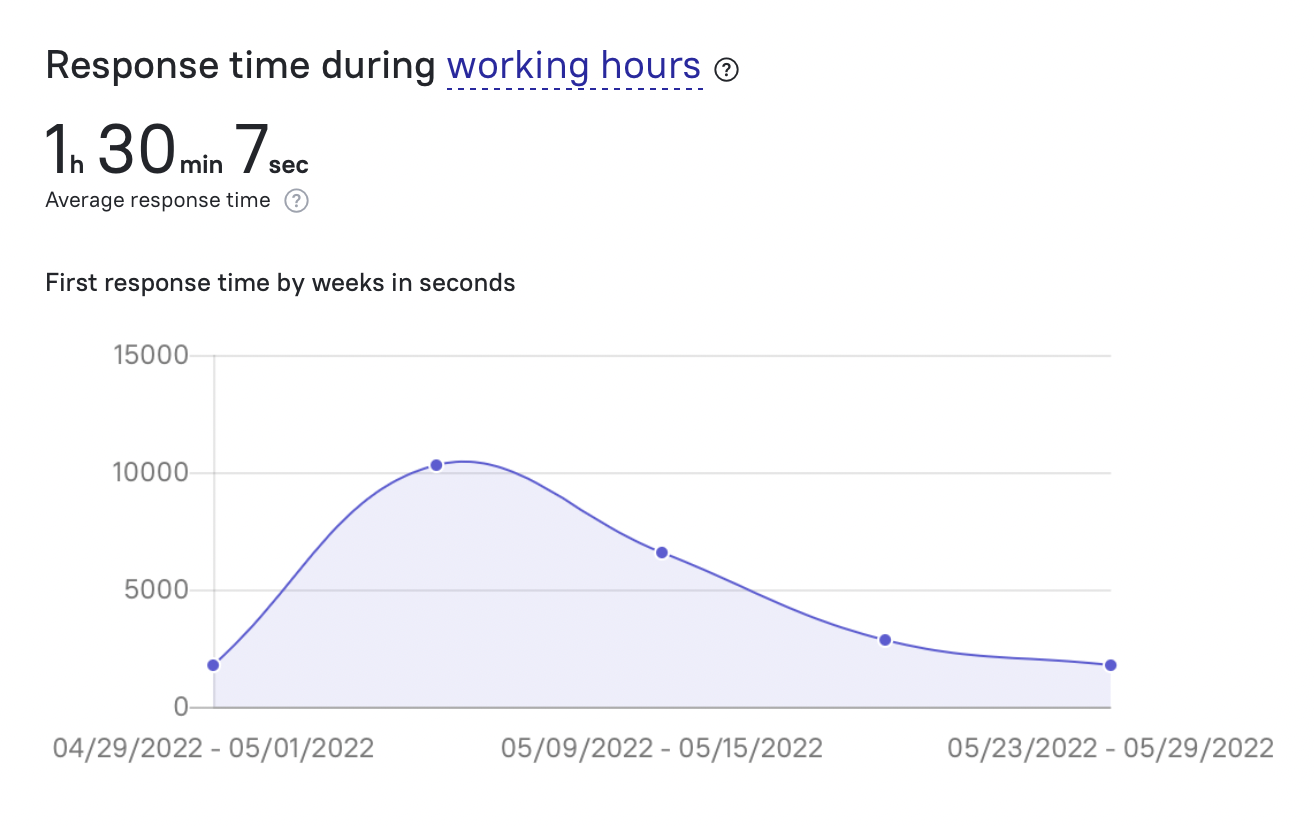
Benchmark: under 1 minute for live chat first response time. Teams that respond in under 30 seconds see the highest CSAT scores. Above 2 minutes, satisfaction drops sharply. If your team can’t consistently hit sub-1-minute, an AI support agent can handle the first exchange automatically while a human prepares to take over.
First response time and resolution time
What this performance metric means: how quickly the team responds to user questions.
To evaluate metrics, measure average response time of your support team. The less time, the better.
To improve metrics, find out what affects the response time (e.g. support agents don’t have time to take on a new issue because they are loaded by others) and try to fix it. Configure automatic replies if metrics related to time are low.
This is one of the most critical live chat performance metrics — speed is the key. Imagine that a user has three tabs opened in their browser with your competitors’ websites; whoever responds first will win. Then, you can start communicating with your users right in the search results.
Read also: 17 Zendesk alternative services and 13 live chat alternatives to try this year
And don’t forget to check out if your live chat slows down your website.
If current customers contact you via live chat, the stakes are even higher: they paid you and want to resolve their issue quickly. If this does not happen, they will leave. Remember that existing customers bring more profit than new ones? The low speed at this stage will spoil all the live chat performance metrics, not only the response time.
Best for your metrics is if the answer is up to 10 seconds (here, we are talking about the response to the first message from the user in a chat). It is very important that the first answer is at least slightly personalized.
Bad:
“Good afternoon! We are processing your request. Please, wait.”
Good:
“Hello, John! I just need 30 seconds to look at the catalog and help you choose the chairs.”
To improve performance metrics, it is also important to consider the time between the following responses, but try to keep a balance. There are really complex issues that require a long and detailed answer, but it is very important to show the user that you didn’t forget about them.
Automatic replies will help maintain attention. If customer support agents don’t have time to answer, a user will receive an automatic reply and see that their issue is being processed.
Many live chat services provide this feature and will help you improve your chat performance metrics.
Do not forget to set up automatic replies during non-working hours. They will not only say that there are no support agents but also help capture leads and boost marketing and sales performance metrics as well.
Then you can check the response rate during working hours and non-working hours.
Read also: The secret weapon of your competitors or Why you should focus on customer service first
Chat volume
What this performance metric means: do users ask the same number of questions every day, or on certain days, do they ask more/less?
To evaluate metrics, calculate the number of new questions. It is hard to say for sure, but it is still better if there are not so many questions.
To improve metrics, optimize the support team working schedule depending on when the majority of new questions arrive.
On the one hand, many new questions mean that your chat is working — users are interested in a conversation and are ready to solve their issues instead of leaving you. On the other hand, this is a red flag when many things are unclear to your website visitors.
When analyzing such performance metrics, calculate the number of questions in a live chat and their content: perhaps one particular function causes difficulties. If the number of questions has risen sharply, this is also a reason to thoroughly consider and analyze other live chat metrics to find out the reason.
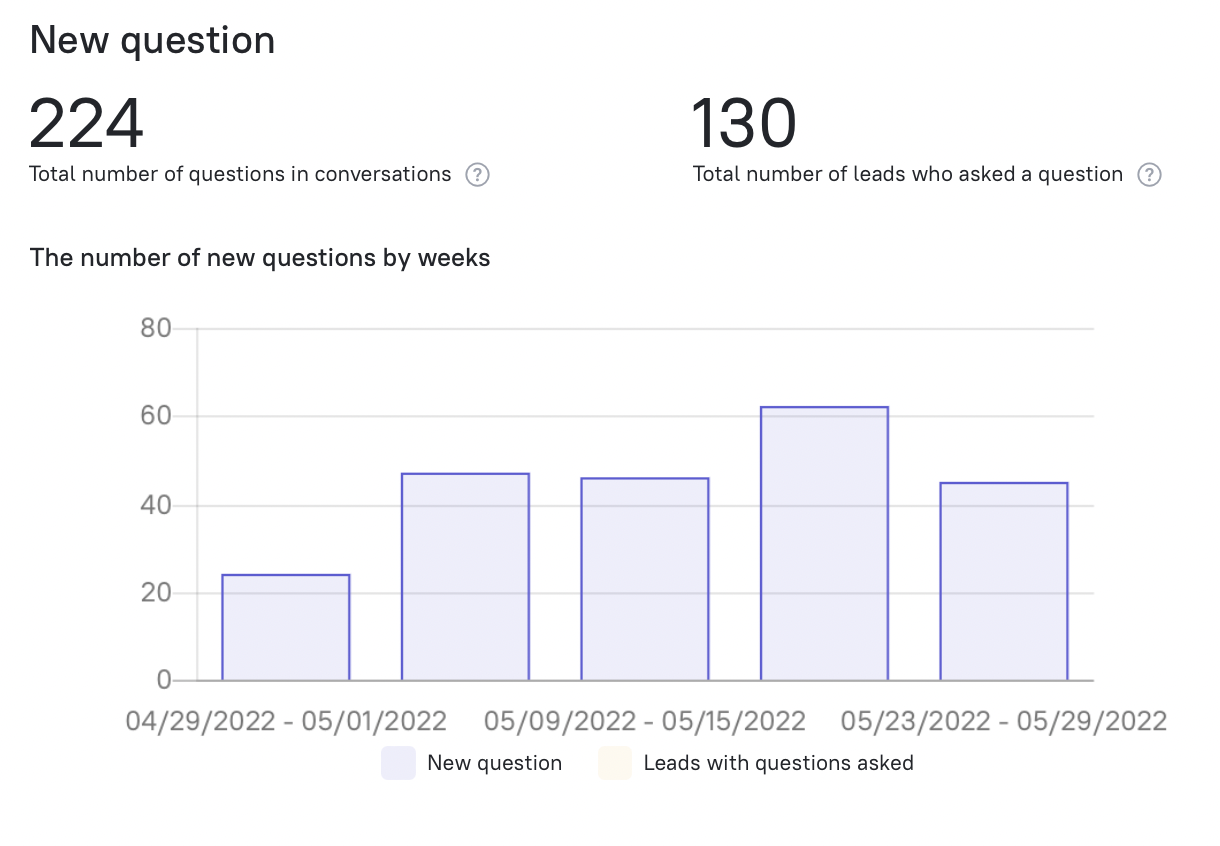
You can also see the daily distribution of new questions to identify days with the highest and the lowest load. For example, you may find out that you have an increasing number of questions on release days.
If you notice a consistent trend in performance metrics (for example, the number of questions increases dramatically on the last Thursday of each month), identify the reason and help the support team. During a sharp increase, they may simply not be able to cope with the load, spoiling live chat performance metrics statistics and reputation among users.

Unique users in chat
What this performance metric means: how many questions a user has on average.
To evaluate metrics, calculate the number of users who write to your customer support team. The fewer, the better.
To improve metrics, track chatbot for business, analyze frequently asked questions in your live chat and set up hints.
Each customer can ask an unlimited number of questions, and some performance metrics become difficult to track. Therefore, it is better when one message contains exactly one problem; in this case, it will be more convenient for you to evaluate support agents’ efficiency by performance metrics.
For example, a user sometimes lists eight complaints in one question; we still consider it one question (just a huge one).
Therefore, there will always be more questions raised than there are users who open them. Live chat performance metrics will help you find imbalance — for example, when there are 50 conversations and two users, pay attention to this. Check if such talkative users are bots and how reasonable the questions they ask in a live chat. If someone addresses the live chat due to boredom and takes the time of your support team, it spoils your performance metrics. Think about how you can protect your team from their messages.
Read also:
⭐ 2025 Email Sales Funnel: How to Maximize Conversions with 11 Proven Examples
⭐ The Leaky Funnel: 6 Powerful Strategies to Stop Losing Leads
Resolution rate
What this performance metric means: how many users’ questions the team manages to resolve for a given period.
To evaluate metrics, calculate the number of resolved issues. The more, the better.
To improve metrics, expand the staff if the support team does not have time to handle all issues. If certain questions cause difficulties, provide additional training and write new articles in a knowledge base.
This and other live chat performance metrics will help determine how many questions your support team has time to process. You can analyze the number of resolved issues by day or by week.
It is logical when the number of resolved issues should approach the number of open ones. If the gap is too wide, your support team can’t handle the load. Then it’s a sign that you may need to train your live chat agents to improve your live chat performance metrics.
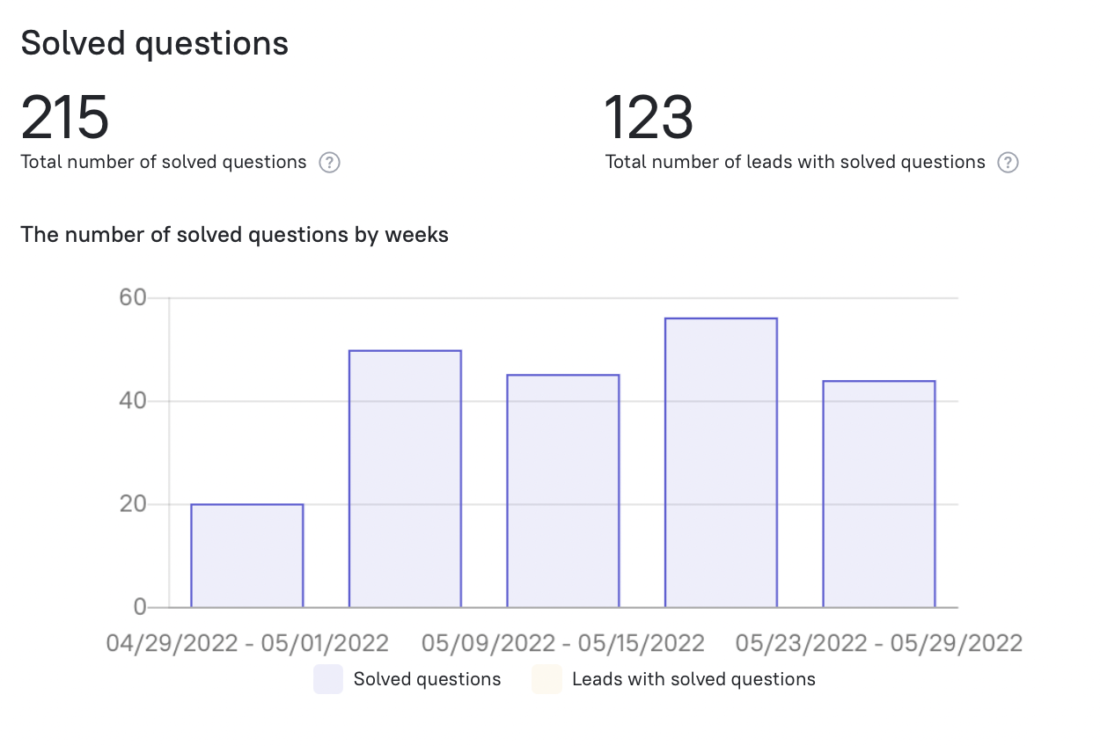
This metric is frequently expressed as a resolution coefficient, that is, the ratio of successfully resolved questions to the total number of questions.
Benchmark: 70–75% first contact resolution is the industry median for live chat. Below 60% typically signals a knowledge base gap or routing problem — agents are resolving the same issues in multiple conversations instead of one.
First contact resolution (FCR) rate
What this performance metric means: how many users you have been able to help.
To evaluate metrics, calculate the number of users whose questions were resolved. The more, the better.
To improve metrics, constantly analyze errors and do not close a conversation until a user is fully satisfied.
This live chat performance metric can be analyzed as a relation to the total number of resolved conversations. If metrics are too different, something goes wrong. Perhaps support agents close the conversation before making sure that a client understands everything and is completely satisfied.
On the other hand, customers who ask many questions may be the most loyal users, trying to understand the product thoroughly. In any case, it’s worth considering what happens.
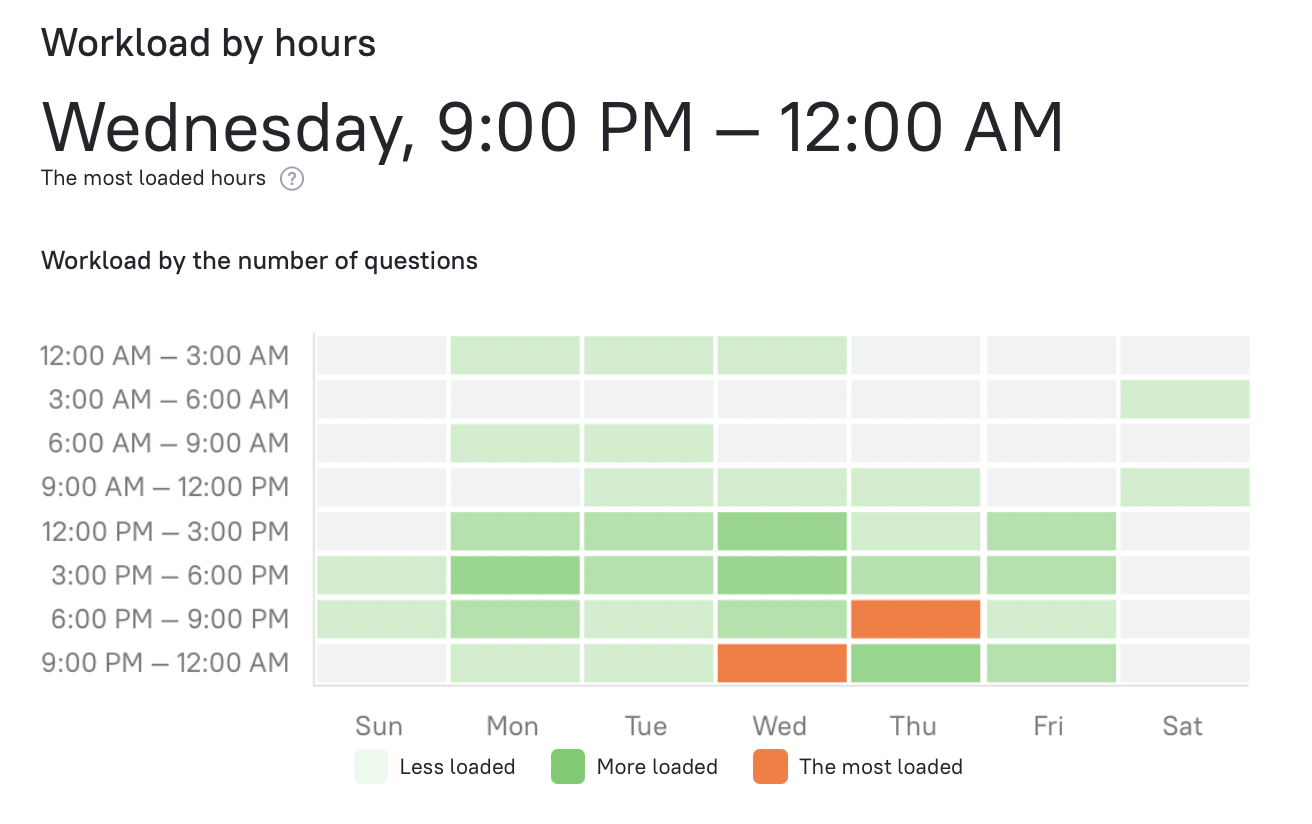
Chats per agent and workload distribution
What this performance metric means: at what time your support team is most loaded.
Don’t evaluate metrics; just remember it.
To improve metrics, distribute the workload among support agents based on the “hottest” hours.
Track your support team’s workload by hours. This is one of the most important performance metrics because this enables you to optimize the entire support team’s work.
If you know when support agents have to process the most requests, you can adjust the operating mode, direct the maximum resources to hours when the load is maximum, and improve live chat metrics.
Agent performance metrics
Tracking metrics of the individual performance of each support team member is just as important as their overall result. This way, you can make the support team’s work easier and live chat performance metrics better: reward the best live chat agents and help the lagging ones.
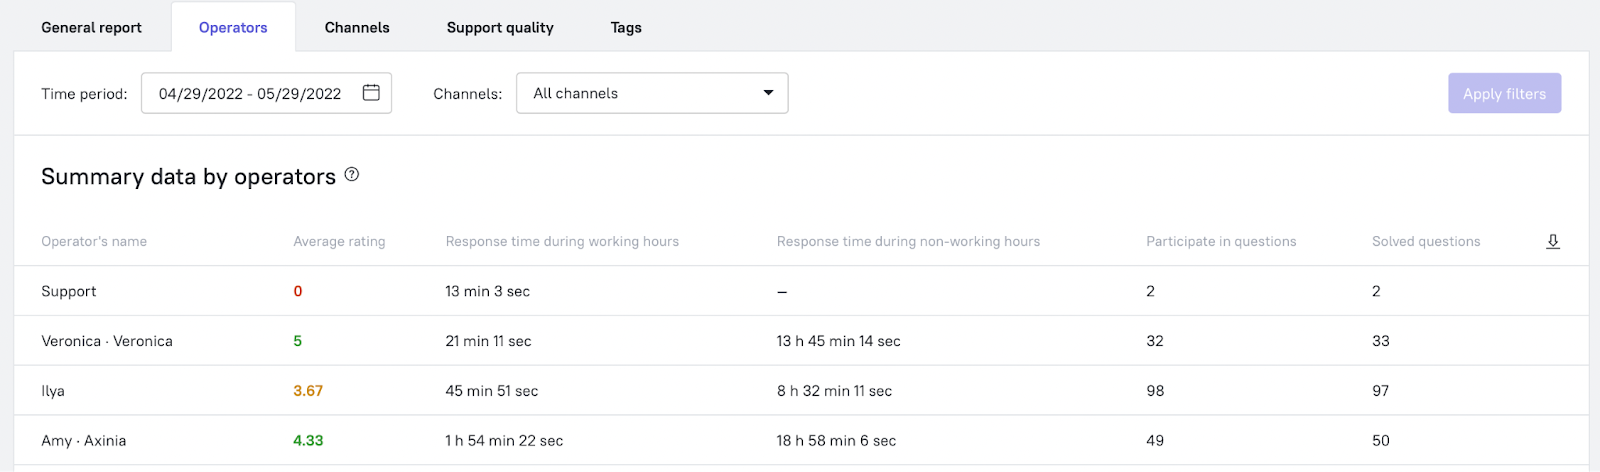
We advise you to pay attention to the following individual live chat performance metrics:
- The live chat agent’s response speed — when you know the average response time of the whole support team, evaluate the response time of each agent during working and non-working hours.
- The live chat agent’s score — how users rate the support team’s performance. If employees of different teams communicate with users, you can distribute agents across the channels and evaluate the work of each team to improve live chat metrics. It’s convenient to look at the overall rating and then consider the ratings of each support agent.
- A number of questions each customer support agent is involved in — see the number of open conversations in which a particular live chat agent is involved. Note whether they cope with the number of conversations assigned to them (compare it with the number of resolved issues).
- Questions resolved — helps evaluate the amount of work each support agent does.
Read also: 15 best lead generation services to grow your base in 2023
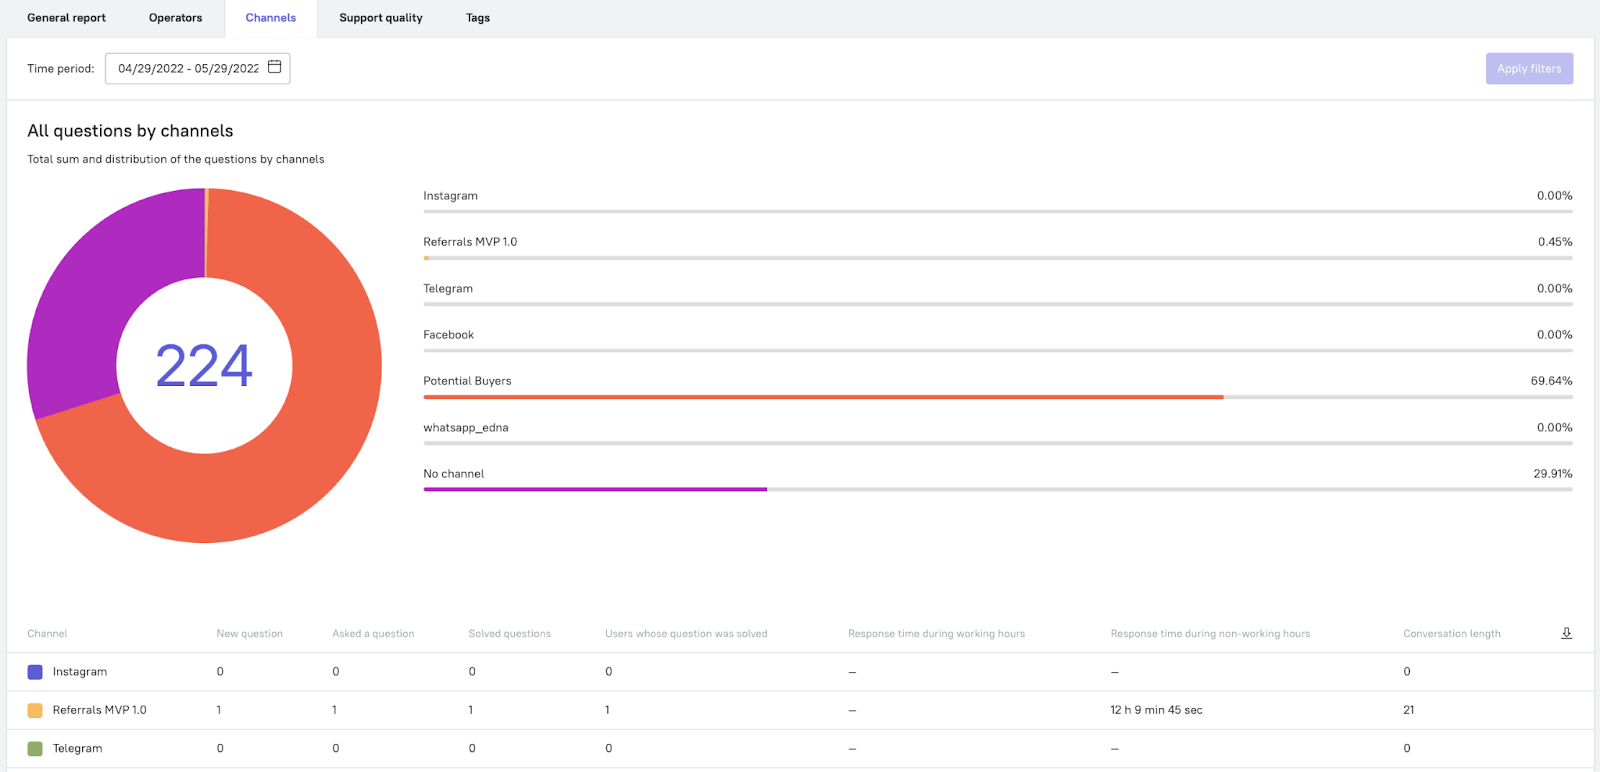
Metrics by channel
If there are several channels to communicate with users (email, live chat, messengers, and so on), it makes sense to collect data for each channel to get relevant data about live chat performance metrics.
Statistics grouped by channel help analyze the support agents’ efficiency in each channel. There are all necessary live chat metrics for this:
- new and resolved questions,
- users whose questions were solved and users who asked new questions,
- response speed during working and non-working hours,
- and the length of the conversation.
Read also: 10 conversion rate optimization tools to enhance your funnel and boost revenue
CSAT and quality score
After support agents have closed the conversation, users can rate their work. In total, Dashly offers three ratings: “Excellent!”, “Ok”, and “Bad”. It’s better to start the analysis with unsatisfactory ratings. Questions with the “Ok” rating also deserve your attention, and the “Excellent!” rating is there exclusively for your joy and happiness. A user can comment on their rating: you can view comments on the “Bad” and “Ok” ratings in the same section and analyze performance metrics in more detail.
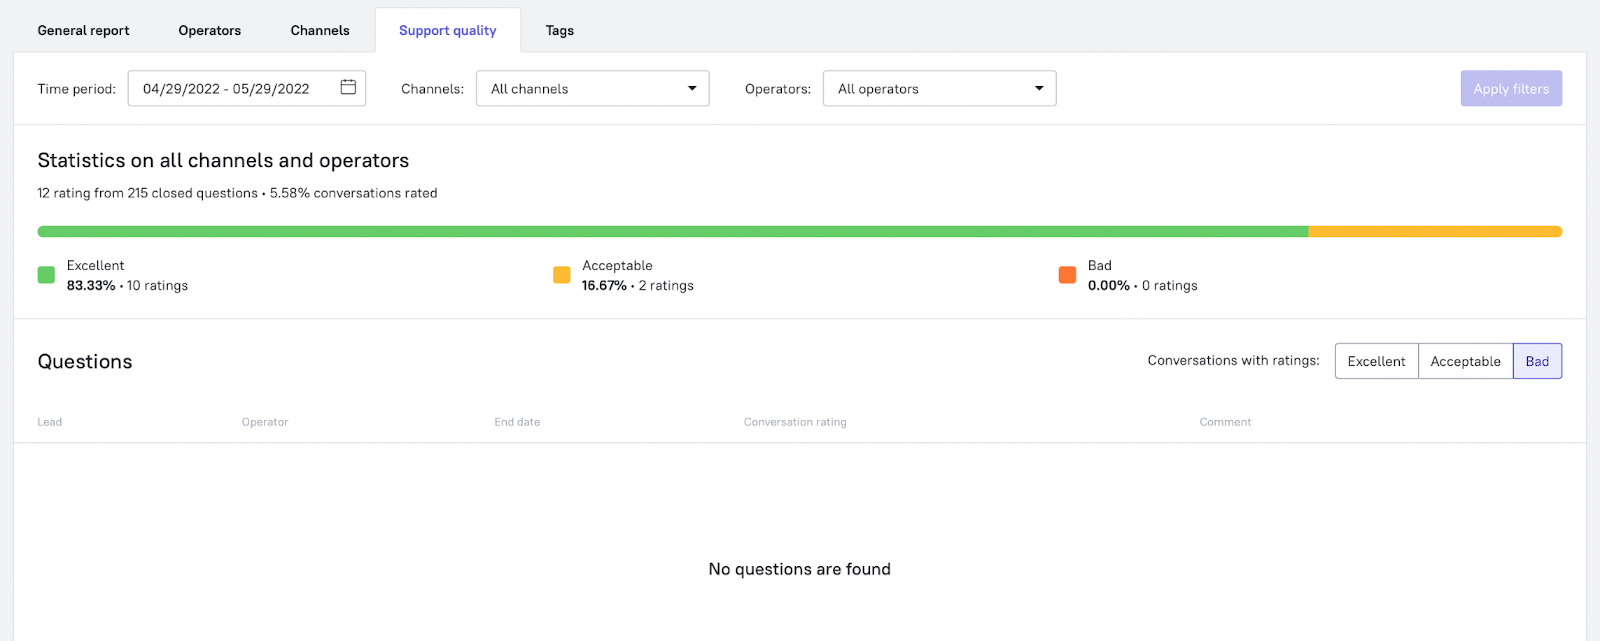
By the way, in the same section, you can open the resolved question. This will help find out if a support agent really worked badly or if a user felt cranky.
Live chat performance metrics help objectively assess the situation and respond in time if something goes wrong. Don’t forget to monitor the quality of user support (all the more you can conveniently and quickly conduct all analytics in one place), and they will thank you for this with loyalty and a high LTV.
Benchmark: CSAT of 85%+ is considered excellent for live chat; below 70% warrants immediate review. Pair CSAT with FCR — high FCR with low CSAT often means issues are technically closed but customers aren’t satisfied with how.
Missed chat rate
What this performance metric means: the percentage of incoming conversations that went unanswered by your team.
To evaluate metrics, calculate the ratio of missed conversations to total incoming chats over the same period.
To improve metrics, review your staffing schedule against peak hours from the workload chart, add an automated first response to hold visitors while an agent joins, or route low-priority chats to a bot first.
Missed chat rate is the share of conversations that started but received no agent response. A visitor who opens a chat and gets no reply will almost certainly leave and not return. Even a short automated acknowledgment — “We’ve received your message and will reply in 2 minutes” — is enough to hold most visitors.
Benchmark: below 5%. Teams running 24/7 coverage with AI agents typically see missed chat rates under 2%.
AI agent deflection rate
What this performance metric means: the percentage of conversations fully resolved by an AI agent without human intervention.
To evaluate metrics, track what share of conversations close without a human agent ever joining the thread.
To improve metrics, expand your AI agent’s knowledge base, add trigger rules for common question patterns, and review conversations where the AI handed off to a human to find the gaps.
Deflection rate directly measures how much load your AI support agent handles autonomously. A higher rate means less load on human agents without reducing customer satisfaction — as long as the AI is actually resolving conversations, not just closing them. In Dashly, the AI qualifier agent also qualifies leads automatically, so deflected conversations still contribute to the pipeline.
Benchmark: well-configured AI agents typically deflect 30–60% of conversations. Below 20% suggests the agent needs more knowledge base content or better trigger rules.
Customer effort score (CES)
What this performance metric means: how easy it was for a visitor to get their issue resolved, rated on a 1–7 scale.
To evaluate metrics, collect CES via a post-chat survey immediately after conversation close. Lower scores mean higher effort — the opposite of CSAT.
To improve metrics, look for patterns in high-effort conversations: did the customer have to repeat themselves? Transfer between agents? Wait more than once? Each of those is a friction point you can remove.
Customer effort score catches friction that CSAT misses. A customer can rate an interaction 5/5 and still find it too hard to reach support in the first place. Lower effort correlates with higher retention: customers who had a low-effort experience are more likely to repurchase and less likely to churn than customers who had a high-effort one, even when CSAT scores are identical.
Live chat analytics FAQ
What is live chat analytics?
Live chat analytics is the collection and analysis of data from chat conversations: response times, resolution rates, customer satisfaction scores, volume by hour and channel, and AI agent performance. Analytics tell you where your support is fast and where it breaks down, so you can make data-driven decisions about staffing, training, and tooling rather than acting on gut feel.
What are the most important live chat metrics?
The five most important live chat metrics are: first response time (how fast you reply), first contact resolution rate (how often you solve in one conversation), CSAT (customer satisfaction score), chat volume (how many conversations your team handles per day), and AI deflection rate (how much of the load AI agents handle autonomously). Start with these five before tracking others.
What is a good first response time for live chat?
Under 1 minute is the industry benchmark for live chat first response time. Most customers expect a reply within 30–60 seconds of starting a conversation. Above 2 minutes, satisfaction scores drop significantly. If your team can’t consistently hit sub-1-minute, consider adding an AI agent to handle the first exchange automatically while a human prepares to respond.
What is the difference between live chat metrics and live chat analytics?
Metrics are individual data points: first response time is 45 seconds, CSAT is 87%. Analytics is the process of combining, segmenting, and interpreting those metrics to find patterns. Noticing that CSAT drops every Monday between 9 and 11am is analytics — it tells you to add agent coverage during that window. Metrics are inputs; analytics is the decision-making layer on top.
And just in case you’re considering changing your live chat solution and finding the best website live chat software for customer support, we’ll send help to you. Here are our articles about live chats based on users’ reviews and our expertise:
👉 Live Chat Best Practices: 20 Hacks to Make Customer Service Better
👉7 Best Live Chat for eCommerce: Boost Conversion on your Website
👉 Top 5 live chat mobile app: find the best fit for your business
👉 Live Chat: How Online Chat Tool Can Help Your Business
👉 20 Best Live Chat Software for your website chat service

Read also: Customer engagement strategy template to create omnichannel campaigns