Customer service automation ROI: how to calculate it and what to expect in 2026
Companies that automate customer service see an average return of $3.50 for every $1 they invest, according to Freshworks research. That number sounds compelling in a vendor pitch. It is harder to defend in a budget review without a calculation your CFO can follow.
Most customer service leaders know automation saves money. Fewer know exactly how much, how to measure it, or what to expect in the first 12 months. The result: automation projects either never get approved, or never get measured, which makes it impossible to justify the next investment.
This guide gives you the ROI formula for customer service automation, the five metrics to track, and 2026 benchmarks segmented by business type, so you can build the business case and know what good actually looks like.
What is customer service automation ROI?
Customer service ROI measures the financial return generated by automating support workflows, compared to the cost of implementing and running the automation. It is not a single number. It has three components, and teams that measure only one of them consistently underreport or overreport their results.
Cost savings is the most visible component. Every ticket resolved by an automated system instead of a human agent reduces the cost per interaction. Human agent handling costs average $15 to $20 per ticket when you factor in salary, overhead, and tool costs. Automated resolution costs $1 to $3. When you deflect 500 tickets a month, the savings compound quickly.
Productivity gains are the second component, and they are often ignored. AI-assisted agents, where automation handles routing, summarization, and suggested responses, let human agents resolve issues 47% faster, according to Gartner. That freed-up capacity means your existing team handles a higher ticket volume without additional headcount, which is a direct cost avoidance.
Revenue impact is the third component, and the hardest to quantify. Customer service speed and quality directly affect retention. In a subscription business, CSAT improvements translate to lower churn, and lower churn translates directly to ARR. A 5% improvement in customer retention produces profit increases of 25% to 95%, according to Bain and Company research.
Ticket deflection rate is a leading metric, not a measure of ROI on its own. Teams that measure deflection without tracking CSAT and FCR often find that cheap automated resolutions are producing poor experiences, which erodes the retention benefit and understates the true cost.
The first step before calculating any ROI is establishing a baseline: your current cost per ticket, your current CSAT score, and your current agent handle time. Without a baseline, there is nothing to compare the result against.
The customer service automation ROI formula
The calculation follows a standard structure. What changes for each team is how you define and measure net savings. You can think of this as your ROI formula applied to the support function — a customer service ROI calculator you can run in a spreadsheet.
The basic formula:
ROI = (Net Annual Savings — Annual Tool Cost) / Annual Tool Cost × 100%
Net Annual Savings has three sub-components:
- Ticket deflection savings: Cost per ticket × Monthly deflected tickets × 12
- Agent time savings: (AHT reduction in minutes / 60) × Agent hourly rate × Monthly ticket volume × 12
- Retention value: (CSAT improvement × Estimated churn reduction) × ARR
You do not need to capture all three components immediately. Most teams start with ticket deflection savings, which is the most measurable, and add the others as their tracking matures.
Before plugging in numbers, confirm your Annual Tool Cost reflects the full total cost of ownership (TCO): monthly subscription, implementation work, integration fees, and any agent training time. Teams that count only the license fee routinely understate their true automation costs, which inflates projected ROI and creates credibility problems at the next budget review.
Worked example:
A B2B SaaS company handles 1,200 support tickets per month. They implement an AI agent that deflects 500 of those tickets — a 42% deflection rate.
- Ticket deflection savings: 500 tickets × $8 cost per ticket × 12 months = $48,000/year
- Agent time savings: 2-minute AHT reduction × $25/hr agent rate × 700 remaining tickets × 12 months = $7,000/year
- Annual tool cost: $800/month × 12 = $9,600/year
- Net savings: $55,000 — $9,600 = $45,400/year
- ROI: ($45,400 / $9,600) × 100 = 472%
That ROI holds even if deflection drops to 30%. At 30% deflection (360 tickets per month), ticket savings alone total $34,560 per year against a $9,600 tool cost, producing a 260% ROI.
The Dashly AI agent handles routing, resolution, and escalation in a single agentic workflow for B2B SaaS teams, covering account inquiries, FAQ responses, and onboarding questions without human involvement. Teams that deploy it alongside human agents see the agent-time savings component grow as the AI handles the high-volume, low-complexity queue, while human agents focus on the cases that actually require judgment.
Customer service automation ROI benchmarks for 2026
Customer service automation ROI benchmarks for 2026: average return is $3.50 per $1 invested, with top implementations reaching 8x. B2B SaaS and SMB teams reach payback in 60 to 90 days; enterprise implementations take 8 to 14 months. Cost per ticket drops from $15 to $20 (human) to $1 to $3 (automated). Detailed ranges below.
Average ROI: $3.50 return per $1 invested, with top-performing implementations reaching 8x, according to Freshworks research. The range is wide because ROI depends heavily on baseline ticket volume, pre-automation cost per ticket, and how comprehensively the tool is deployed.
Time to first positive ROI:
- SMB and SaaS teams: 60 to 90 days
- Mid-market: 3 to 6 months
- Enterprise with complex implementations: 8 to 14 months
The faster payback for smaller teams comes from faster deployment, lower integration complexity, and a higher proportion of standardized ticket types that are easier to automate.
| Resolution type | Cost per ticket |
|---|---|
| Human agent (loaded cost) | $15–$20 |
| AI-assisted agent (human + AI) | $7–$10 |
| Fully automated | $1–$3 |
The most realistic target for most B2B SaaS teams in the first year is moving the average cost from $15 down to $9 to $10, rather than expecting full automation of every ticket type.
Agent productivity benchmarks (Gartner, 2025):
- First contact resolution rates improve by 25% with AI assistance
- Average first response time drops from over 6 hours to under 4 minutes in AI-assisted deployments (Freshworks, 2025)
These gains translate directly into operational efficiency improvements. A five-agent team handling 1,500 tickets per month with a 47% AHT reduction recovers roughly two agent-hours per day — the equivalent of a quarter-FTE — without adding headcount or budget.
Market context: The customer service automation market reached $13 billion in 2024 and is projected to reach $83.85 billion by 2033, growing at 23.2% CAGR, according to Grand View Research. By 2025, 80% of customer service organizations were expected to integrate generative AI tools, according to Gartner.
Teams that implement automation with a measurement framework from day one consistently outperform those that deploy first and measure later. The highest-ROI implementations share one trait: they established a cost-per-ticket baseline before going live.
Which metrics measure customer service automation ROI?
These five metrics form your working customer service ROI statistics framework, showing each month whether your automation is generating the return you projected or drifting in the wrong direction. They map directly to the AI customer support tools category your team is evaluating.
1. Ticket deflection rate
Deflection rate measures the percentage of support requests resolved without a human agent touching them. It is the primary driver of cost savings in most automation implementations.
Formula: (Deflected tickets / Total tickets initiated) × 100%
Target: A deflection rate above 40% is strong for B2B SaaS. Teams below 20% are typically deflecting only the lowest-complexity tickets — FAQs and status checks — and have more to gain from expanding their automation scope.
Deflection rate trends month over month are more useful than the absolute number. A rising deflection rate with stable CSAT means the automation is learning and expanding correctly.
2. Cost per interaction
Cost per interaction measures the total support cost divided by the number of support interactions in a period.
Formula: (Total agent hours × hourly loaded cost + tool costs) / Total tickets resolved
Benchmark: Human agent handling averages $15 to $20. AI-assisted handling averages $7 to $10. Fully automated resolution averages $1 to $3.
Track this monthly to see the cost curve flatten as deflection grows. A falling cost per interaction with stable or improving CSAT is the clearest signal that automation is working.
3. Average handle time (AHT)
AHT measures the active time an agent spends handling a ticket. It differs from resolution time — the total elapsed clock time from first customer contact to ticket close, which includes wait periods between replies. Both should track downward with AI assistance. AHT matters for ROI because agent time has a direct dollar value.
A 20 to 30% AHT reduction is typical for teams using AI-assisted tooling, according to Gartner. Even without full automation, AI that surfaces relevant knowledge base articles, drafts suggested responses, and auto-categorizes tickets reduces the time each agent spends per ticket.
Formula for time savings: (AHT reduction in minutes / 60) × Agent hourly rate × Monthly ticket volume = Monthly agent savings
4. First contact resolution (FCR) and CSAT
FCR measures whether the customer’s issue was resolved on the first interaction, without follow-up. It is a proxy for service quality and a direct driver of retention.
Higher FCR means fewer repeat contacts, lower cost, and higher customer satisfaction. Lower FCR means customers return for the same issue, which inflates ticket volume and erodes the deflection savings you are reporting.
CSAT is the check on deflection rate. A team running 60% deflection with a CSAT score dropping from 85 to 72 is reducing costs while damaging revenue. The customer service KPIs that matter for ROI are always pairs: deflection and CSAT, FCR and cost per interaction. Teams tracking NPS alongside CSAT get an additional signal: a CSAT improvement that does not move NPS within two to three quarters suggests the gains are not reaching high-value accounts, which limits the retention ROI.
Dashly surfaces FCR and CSAT trends per conversation in the dashboard, flagging unresolved threads and low-satisfaction patterns before they compound into churn signals. This lets teams catch automation quality issues early rather than discovering them in a quarterly retention report.
5. Self-service adoption rate
Self-service adoption rate measures the percentage of users who resolve issues through the knowledge base, help center, or bot without creating a support ticket at all.
Formula: (Self-service resolutions / Total support requests including self-service) × 100%
Target: Above 30% is strong for B2B SaaS. Teams above 50% have typically invested heavily in knowledge base quality alongside the automation layer.
This metric is a leading indicator. It does not appear on a cost savings report immediately, but teams with high self-service adoption consistently see lower ticket volumes 3 to 6 months later, which compounds the ROI of any automation investment. The pattern holds across documented automated customer service examples in B2B SaaS.
Why B2B SaaS teams get higher ROI from customer service automation
The $3.50 average ROI is an average across industry types and company sizes. B2B SaaS teams consistently outperform it for four structural reasons.
Smaller ticket volume compounds faster. A 40-person SaaS company handling 800 tickets per month reaches payback on a $800/month automation tool in 60 to 90 days. The same tool deployed at an enterprise with 50 agents takes 12 months to reach the same percentage ROI, because the implementation is more complex and the cost structure is harder to change quickly. Scaling customer service without expanding support team capacity is the core ROI mechanism that makes automation economically different from other software spend at the 50 to 200-person stage.
Digital-native users prefer self-service. SaaS customers are product-led in their thinking. They expect to resolve issues themselves before contacting support. This means deflection rates are structurally higher for SaaS products than for B2C services or legacy enterprise software. A well-configured AI agent that knows the product deeply can reach 50 to 60% deflection rates in SaaS, where 30% would be more typical in other sectors.
The retention math is visible. Subscription revenue makes the CSAT-to-churn-to-ARR calculation traceable. If CSAT improves by 8 points and churn drops by 1.5% on a $2M ARR base, that is $30,000 in retained revenue from a support improvement. That calculation is much harder to make in a transactional business model.
Agentic AI unlocks resolutions that chatbots cannot handle. Rule-based chatbots deflect simple FAQs. Agentic AI systems handle multi-step support flows: account configuration help, integration troubleshooting, billing inquiries requiring account lookups. The expansion of what automation can resolve is where the next layer of ROI sits for teams that have already captured the easy wins.
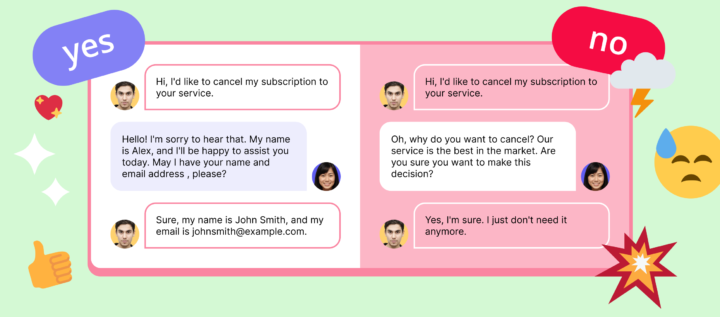
An example of a conversation with an AI agent:
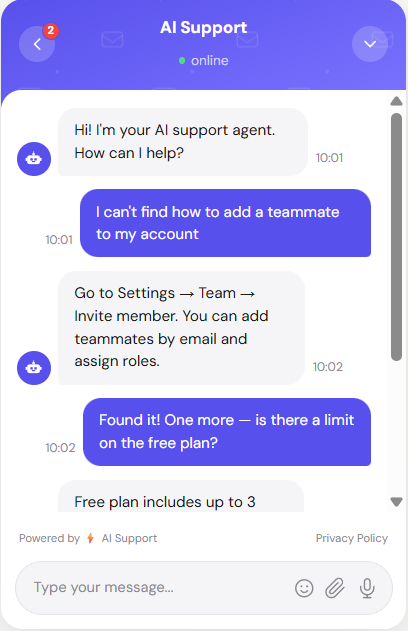
SaaS teams retain more customers when first response time drops below two minutes. The Dashly AI agent achieves this for B2B SaaS teams by combining routing, resolution, and escalation in a single agentic workflow, without requiring a human to initiate the process.
4 mistakes that kill your customer service automation ROI
These are the four most common failure modes in customer service automation, documented across implementations that started well and underdelivered.
1. Automating before documenting
AI agents learn from what they are given. Teams that deploy automation without first documenting their resolution workflows, categorizing their top ticket types, and cleaning up their knowledge base feed the system inconsistent information. This applies equally to native AI platforms and AI add-ons layered on top of existing helpdesk software — the training data quality determines resolution quality. The output is inconsistent resolutions that lower CSAT and increase escalation rates.
The fix is straightforward but unglamorous: spend four to six weeks mapping your top 20 ticket types before deployment. That documentation becomes the training foundation and reduces the time to reach acceptable deflection rates by roughly half.
2. Measuring deflection without measuring CSAT
A 50% deflection rate with a 15-point CSAT drop is cost reduction at the expense of revenue, not ROI. The customers who received poor automated resolutions are a churn risk, and the downstream revenue impact will exceed the ticket cost savings within two to three quarters.
Every deflection metric needs a paired CSAT measurement. If deflection rises while CSAT holds or improves, the automation is working correctly. If they move in opposite directions, the automation scope is too broad and the system is resolving tickets it should be escalating.
3. Skipping the baseline
The most common reason customer service automation projects cannot demonstrate ROI six months after deployment is that no one measured cost per ticket, agent handle time, or CSAT before going live. Without a baseline, there is no before, only an after, and an after without a before is not a business case.
Before deploying any automation tool, spend two weeks pulling historical data: average ticket volume, cost per ticket, average handle time, FCR rate, and CSAT score. This takes a day to set up and makes every subsequent measurement meaningful.
4. Over-automating complex cases
AI agent failures on high-stakes tickets are more damaging than no automation at all. A customer who cannot get help with a billing dispute or a data access issue from an automated system is a customer who is evaluating alternatives and writing a review.
Set clear escalation rules from day one. Define the ticket categories where automation must always transfer to a human agent:
- Billing disputes and payment issues
- Legal or compliance requests
- Enterprise account escalations
- Any interaction where the customer expresses high frustration
Automation handles the high-volume, low-stakes queue. The high-stakes queue stays with humans.
Conclusion
Customer service automation ROI averages $3.50 per $1 invested, but that number is only useful if you can calculate your own version of it, defend it in a budget review, and track it month over month. The formula is straightforward: net annual savings minus annual tool cost, divided by tool cost, times 100. The five metrics that make that formula real are ticket deflection rate, cost per interaction, AHT, FCR plus CSAT, and self-service adoption rate.
B2B SaaS teams hit positive ROI faster than enterprise because their ticket volumes are more predictable, their users prefer self-service, and their subscription model makes the retention math traceable. The most reliable way to reach that ROI is to start with a cost-per-ticket baseline, scope the customer service automation to high-volume, low-stakes ticket types first, and expand once CSAT holds steady.
Frequently asked questions
Companies see an average return of $3.50 for every $1 invested in customer service automation, according to Freshworks research. Top-performing implementations reach 8x ROI. Time to first positive ROI ranges from 60 to 90 days for SMB and SaaS teams to 8 to 14 months for enterprise with complex implementations.
ROI = (Net Annual Savings — Annual Tool Cost) / Annual Tool Cost x 100%. Net savings combines ticket deflection savings (cost per ticket x deflected tickets x 12), agent time savings (AHT reduction x agent hourly rate x ticket volume x 12), and optional retention value. Start with deflection savings, which is the most measurable component.
SaaS and SMB teams with straightforward automation scope typically see positive ROI in 60 to 90 days. Mid-market teams reach it in 3 to 6 months. Enterprise implementations with complex integrations typically need 8 to 14 months to reach payback. AI-native tools shorten the payback timeline compared to legacy rule-based chatbots.
AI-assisted agents resolve issues 47% faster than unassisted agents and achieve first contact resolution rates 25% higher, according to Gartner. The direct cost impact is a reduction in cost per interaction from $15 to $20 (human agent) to $1 to $3 (automated) or $7 to $10 (AI-assisted).
Five metrics track ROI accurately: ticket deflection rate (target above 40% for B2B SaaS), cost per interaction (benchmark $15 to $20 human, $1 to $3 automated), average handle time, first contact resolution rate plus CSAT, and self-service adoption rate. Track them monthly in pairs — deflection without CSAT tells only half the story.
Agentic AI agents handle multi-step support resolutions without human handoff: billing questions, account configuration, integration troubleshooting. This extends automation beyond simple FAQ deflection, expands the ticket volume that can be automated, and unlocks a higher ROI ceiling than rule-based chatbots that can only handle pre-scripted responses.