ARPU: definition and calculation

We all put a lot of effort into improving business metrics with one ultimate goal — increasing profits, right?
Seth Godin notes, however, that “A useful metric is both accurate (in that it measures what it says it measures) and aligned with your goals. Making your numbers go up is pointless if the numbers aren’t related to why you went to work this morning”.
If you approach the ARPU right, it combines both profits and value (we’ll elaborate on this below).
So, let’s start with a better understanding of the ARPU and how it could help your business!
What stands for ARPU?
ARPU (or Average Revenue Per User) is the average income from each active user for a given period. It helps businesses digitize product value and forecast profits. Business decisions are usually made based on ARPU.
ARPU calculation
Divide your total revenue for a period by the number of active users you had during this period. Here is an ARPU formula:

Let’s say 600 people used your platform last month. We include free trial users, your super loyal customers, and those on the most advanced plan. Be sure to count everyone who used your product within a month.
Your revenue was $3200. So, your ARPU is 3200/600 = $5,3.

Which ARPU is right?
Okay, we’ve got the figure, so what? Is the revenue of $5,3 per user excellent or bad?
The point is, there’s no ARPU benchmark.
The only rule is: if you see your ARPU is decreasing, you need to acquire more customers or work on your traffic quality.
You can’t evaluate average revenue per user in isolation as it’s bound to your customer count. Let’s consider an example of two similar platforms thriving to make $10 000 monthly.
Note: if you want to compare ARPUs, ground your research on identical companies or products.
Suppose analysts have calculated ARPUs, which were $15 for both platforms. The only thing is that 700 people used Platform 1 (of which 100 were trial period users), while Platform 2 has 300 customers.
So, Platform 1 made more than expected — the revenue was $10 500. At the same time, Platform 2 was not so successful; they only got 300 customers (with the same 100 ones on a free plan) — their revenue was $4 500.
It turns out, if two companies want to make the same profits and have identical ARPUs, it doesn’t mean anything.
You can only evaluate your average revenue per user. Or compare yourself to a company with identical (both quantitatively and qualitatively) customers.
Let’s calculate how much extra revenue your business can get with Dashly
What time frame to use when calculating ARPU?
Generally, companies measure APRU for one month period. However, there are several opinions on what time frame to take for calculating ARPU.
First, decide on what period matches your business tasks. If you’re a subscription-based platform, you can do this exercise monthly. However, if you’re a mobile app with a short average Lifetime, consider calculating your ARPU more often3.
If you’re not a subscription-based platform, consider how often customers need you. Then the period for your average revenue per user calculation maybe three months, half a year, or even a year. So, the tie frame depends on your customers’ lifecycle.
ARPU for traffic quality evaluation
You may use ARPU to evaluate the quality of traffic for a particular period. First, you need to calculate revenue from your users for a certain period. Let’s take all who signed up on June 15. A similar formula calculates it, showing your revenue from a particular user cohort. ARPU will gradually increase for this cohort because this cohort of users may bring you additional income. That’s why it’s called cumulative.
Here is the way you can calculate cumulative ARPU:

Let’s say 800 people signed up for your platform on June 15. The very same day, they made total payments of $600. Your ARPU will be 600 / 800 = $0,75.
Suppose this cohort brought you another $300 the next day. Though some users might have left you or not used the platform on the second day, your cohort is still 800 users. The cumulative ARPU for 2 days will be (600+300) / 800 = $1,125. And it will gradually increase each day and reach your LTV one day.
Calculate cumulative ARPU for one day, a week, or two weeks. This will give you an insight into how much a user brings you when they begin using your platform. You’ll also be able to forecast future revenues from that user. What’s more, you may find out the funnel bottlenecks.
Get a free expert analysis of your website communications and learn where you lose leads

What does ARPU have to do with value?
We’ve said before that ARPU combines revenue and value. Strange, huh? Aren’t we talking only about the money?
ARPU shows how much a user is willing to pay for your product. Suppose you’re offering three plans and a free trial period. Plans cost $15, $20, and $30, accordingly. Your ARPU is $23. If we take trial period users into account, we can say most of your users prefer paid plans.
If most of your users choose the highest plan, there is a big chance that they are highly willing to pay more. You’re losing money if you don’t offer them that.
A high ARPU proves that users value your product. If it reaches your average plan, it’s time to go up the ante!
If the metric approaches your lowest plan, it’s a red flag; you’re not marketing your product right. Maybe you acquire users that pay you little money. Make a strategy change and incline your users to higher plans.
How is ARPU connected to LTV?
These metrics are often confused. They’re connected, but the meaning is slightly different. Each of these metrics is important and cannot be ignored when analyzing a company’s performance.
LTV is revenue from a user during their entire relationship with you. ARPU shows revenues from a user for a given period. The residual is Lifetime, the length of a customer’s relationship with you.

Average revenue per user and average revenue per unit
The average revenue per unit is the revenue you make for every unit of your product. This metric is reliable for companies that offer subscription-based products. Telecommunication companies usually use this metric.
The average revenue per unit calculates the same way as the average revenue per unit, but the meaning is slightly different:

The average revenue per unit may be helpful if your clients have several accounts on your platform, i.e., one person bought several units of your product. Using the average revenue per unit formula, you can calculate the income you gained from every unit, not from a particular client.
In what way ARPU and ARPPU are different?
An additional P in ARPPU means Paying.
ARPU gives you an average revenue, including those who don’t pay anything, while ARPPU shows the revenue you get from paying users only. As there are fewer paying users, ARPPU is always higher.
ARPPU shows how paying users react to your product value. If you increase prices, your ARPPU will go up accordingly. But don’t rush to charge your glasses — maybe this means the share of paying users has decreased with the prices growing, affecting ARPPU.
It’s the Paying Share that binds ARPU and ARPPU.

Let’s say you’ve had 1200 users last month, of which 40 paid for premium accounts. Your revenue was $1000.
ARPU = 1000 / 1200 = $ 0,8
ARPPU = 1000 / 40 = $ 25
The Paying Share is 0,8 / 25 = 0,032 or 3,2%.
An ideal Paying Share depends on your type of business. For example, 1-2% is suitable for mobile apps as most users are on a free plan, and very few people make in-app purchases.
It’s essential to keep track of your Paying Share. If your ARPPU is growing with the Paying Share going down, you’re losing money in the long term. Revenues from paying users won’t beat the decreasing number of them. The metric also helps you evaluate and forecast your revenues.
How to use ARPU for your business
ARPU shows how the price of your product corresponds to its value. How else can you use this metric?
- Comparing yourself to your competitors.
Investors base their decisions on this metric. You can use ARPU to reveal the winner if you run several projects.
Note: be sure only to compare ARPUs of products with identical or similar audiences. - Evaluating the reaction to price changes.
Suppose you’ve decided to increase your subscription fee and see if ARPU for your new users’ changes. Last month, you had 810 newcomers who generated $900. When you increased costs, the user count decreased to 700, and your revenue to $800. Let’s compare two ARPUs to see how price changes affected them.
ARPU before the increase = 900 / 810 = $1,11
ARPU after the increase = 800 / 700 = $1,14
Turns out, this was a grand experiment, and a decrease in income has nothing to do with price increases. If you acquire more active users having the same increased fee, you’ll simply make more money. Amazing, isn’t it? - Choosing acquisition channels.
ARPU is as good for evaluating the acquisition channel performance as is LTV.
Let’s say you had 2200 customers who generated $4000. Your ARPU is 4000 / 2200 = $1,81.
Then you launched an ad campaign and now have 3450 users and $5000. Looks great at first glance, but let’s look at the figures:
ARPU = 5000 / 3450 = $1,44
Your revenues decreased, so maybe you acquired an indifferent audience. - User segmentation.
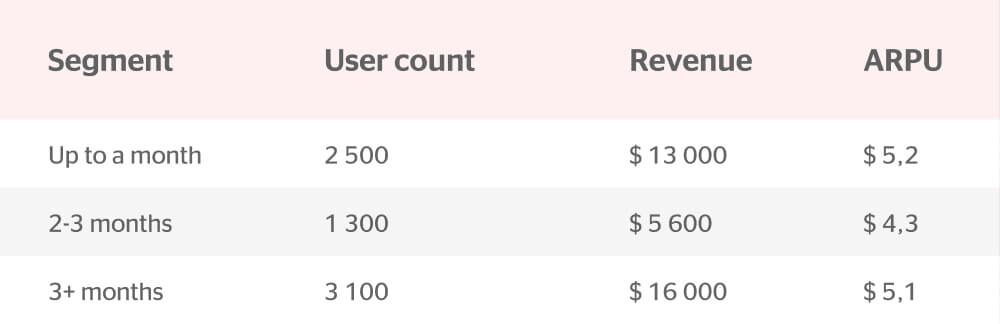
You can segment users by their time on you and compare revenues from each group.
Let’s identify 3 segments: newcomers (less than a month with you; trial period users or paid for their plan once), those who know you well (and have extended their subscription 2-3 times already), and your super loyal customers (who extended their subscriptions 3+ times.
Note: A user may not have paid during the period we calculate ARPU. - 5. Forecasting
You can use ARPU to digitize your acquisition or retention hypotheses. Let’s say you’re launching an ad campaign and expect to acquire 20% more users. Suppose you’ve had 120 monthly users, and now you’re expecting to acquire 144. If your ARPU is 30, your future revenue will be $4320 (while you had $3600). You can see your ad expenses paying off and predict your future revenues.
It turns out you generate the most revenue from your super-loyal customers and newcomers. If you focus on these two segments, you can significantly increase your revenues.
How do I improve the metric?
Whatever your ARPU is, the sky’s the limit. Let’s look at the most common ways to enhance this metric.
- Upselling and Cross-selling. These are the most popular ways to increase the average order value. If you’re a subscription-based platform, you must encourage users to switch to a paid plan to improve your ARPU.
- Play with your plans. Once upon a time, Statuspage.io rearranged their pricing schedule and changed prices. Instead of traditional plans like “Standard” and “Premium,” product managers have devised plans for different customers. Each plan included its own set of features. Some were unknown to users as they were not directly related to a core product. Here’s what it looked like:
Eventually, ARPU has more than doubled. Customer segmentation based on plans and pricing, a clear understanding of customer needs, and specific features have a huge impact on ARPU.
3. Increase your product value. The more often a customer pays you, the bigger their next invoice will be. Work hard on customer acquisition, activation, and retention. The better a user understands the value (and the sooner they do), the more likely they will stay with you for the long haul. This directly impacts your revenues and hence increases ARPU.
Let’s calculate how much extra revenue your business can get with Dashly
FAQ
What is APRU?
ARPU (also known as Average Revenue Per User) is the average income you get from each active user for a given period.
How to calculate ARPU?
You can use the formula below to calculate ARPU:

Is there an ARPU benchmark?
There is no benchmark. You need to evaluate your ARPU dynamics or compare it to a company with identical (quantitatively and qualitatively) customers.
And remember: when your ARPU is decreasing, you need to acquire more customers or work on traffic quality.
How to improve ARPU
- Upselling and Cross-selling
- Change your customer segmentation and try to change features.
- Rearrange your pricing schedule and change prices. Probably some of your phrases are unfamiliar to your customers.
- Increase your product value. The better users understand the value (and the sooner they do), the more likely they will stay with you for a long haul.
May your ARPU skyrocket!
Read also:
👉 Live Chat Best Practices: 20 Hacks to Make Customer Service Better
👉7 Best Live Chat for eCommerce: Boost Conversion on your Website
👉 Top 5 live chat mobile app: find the best fit for your business
👉 Live Chat: How Online Chat Tool Can Help Your Business
👉 20 Best Live Chat Software for your website chat service
👉 Acquisition funnel marketing: Grow customer conversions at each step of user journey
👉 The top 15 inbound marketing tools: harness digital power and elevate your business
👉 10 best website personalization tools to deliver top-notch visitors experience
👉 7 best email capture tools: features and pricing compared for 2024
Featured reading
The ROMI Formula: How To Calculate It?
The ROI formula: How to Calculate It and Why Your Marketing Needs It
Why do you need to know more about LTV metric?
The ROMI Formula: How To Calculate It?
| This article was first published on July 20, 2020. December 20, we’ve updated it. |