How to measure sales enablement: 20+ metrics to track in 2024
Discover the secrets of rapid sales metrics growth from Dashly team experts. What strategies and tools to use, which pitfalls to avoid, what examples and best practices to follow.

Part 1: What is sales enablement? Definite guide + Strategy + Tools
Part 2: How to measure sales enablement 20 metrics to track in 2024
Part 3: AI in sales enablement: 5 strategies to transform your sales process
Part 4: 10 steps to building a sales enablement strategy in 2024
Part 5: How to Create an Automated Sales Funnel: examples & tools
Part 6: 7 sales enablement best practices to empower your team
Part 7: Top 13 sales automation tools to propel your sales strategy
Part 8: 10 Sales Enablement Tools: Best Software To Grow Your Team Performance
Part 9: How to structure your sales enablement team: 10 roles and responsibilities
Part 10: Mastering sales automation: A comprehensive guide to best practices and tools
As the lead of Dashly’s sales team, believe me when I say it’s tricky to nail your sales enablement strategy without accurate metrics. If you can’t show your C-suite the ROI of your strategies, securing the resources for your sales enablement program feels like an uphill battle.
Metrics really are your secret weapon to tweak, enhance, and perfect your sales enablement strategy. It’s all about aligning your program’s outcomes to the organization’s objectives and key results (OKRs) to make a meaningful business impact.
Now, you might be thinking: “Well, then which sales funnel KPIs should I track?” or “How do I succeed in measuring sales enablement?”, but don’t stress! Roll up your sleeves as we dive deep into sales enablement analytics based on insights from 20 industry experts. Let’s jump right in 👇
What are Sales Enablement Metrics?
Sales enablement metrics are, well, metrics, measures used to assess the success and effectiveness of your sales enablement objectives and goals. These metrics provide insights into your sales team’s performance — enabling you to tweak your strategies for continued growth accordingly.
Obviously, you cannot measure something that you can’t easily locate or define. The content your metrics are based on also should be easily applicable in daily sales processes.
Here are some Enablement KPIs to consider:
- Deal Length, or the average time it takes to close a deal.
- Sales Cycle Speed, or the average time from a lead entering the funnel till deal closure.
- Sales Content Usage, or how often sales content is accessed and used.
- Training Completion Rate, or the rate at which your sales team finishes enablement training.
- Sales Target Achievement, or the percentage of the sales target met by the team.
Why Should Sales Enablement Be Measured?
If there’s one thing I’ve learned from my time in sales and marketing, it’s that measuring sales enablement is not just a good idea — it’s essential. Let me tell you why.
First, it’s all about visibility.
Sales enablement metrics give you clear, quantifiable insights into the performance of your sales team and strategies. You’re able to see what’s working, and — more importantly — what isn’t.
Second, metrics help to drive improvements.
Once you’ve identified areas where performance is lagging, you can set about fixing them. You can’t fix what you can’t see, right?
Third, measuring sales enablement highlights training needs.
Is there a part of the sales process where your team is consistently struggling? That’s a clear sign that further training or enablement might be necessary.
Fourth, collecting this data and analyzing it helps align marketing and sales.
Shared metrics drive shared goals, and that’s when marketing and sales become a truly powerful combination. Read more about how we created Hulk from sales and marketing teams at Dashly.
Lastly, metrics matter to the rest of the business.
Clear, quantifiable data is a language that the entire organization understands. This makes it easier to communicate about sales & enablement, build cross-department understanding, and secure resources.
In short, sales enablement metrics help to refine your sales strategy, align your team, highlight training needs, and communicate effectively with the rest of the business. Measure, analyze, improve — you might call it the mantra of successful sales enablement.
Read also: Boost Your 2025 with These 10 Sales Funnel Benefits
How to Identify, Benchmark, and Analyze Sales Enablement Metrics
It’s time we talk business, specifically, effectively identifying, benchmarking, and analyzing sales enablement metrics. Here’s a step-by-step guide:
- Identify Relevant Metrics
- Define Benchmarks
- Collect Data
- Analyze Data
- Apply Results
Identify Relevant Metrics
Start by identifying which sales enablement metrics best reflect your company’s goals. These might relate to overall sales growth, conversion rates, customer retention, or even the productivity of individual sales reps. Remember, these metrics are key to measuring sales enablement effectiveness.
Define Benchmarks
Once you have defined your metrics, set your benchmarks. Benchmarking involves defining what success looks like for each metric. Consider industry standards, your past performance, and your future sales enablement objectives.
Collect Data
Next, organize your data collection process. Ensure that you have the necessary tools in place to accurately collect data for each chosen metric. This might involve using sales analytics software, customer relationship management (CRM) tools, and feedback surveys.
Analyze Data
After gathering the data, analyze it to extract meaningful insights. Look for patterns, trends, and anomalies. Are there any particular areas where your sales team excels? Or, are there areas where performance is consistently lagging? Asking these questions is crucial when measuring and improving sales enablement.
Apply the results
Lastly, apply your insights. If a particular strategy is working well, consider how it can be scaled. Conversely, if a metric is falling short of your benchmark, consider what adjustments can be made — perhaps a change in tactic, additional training, or deeper alignment with marketing.
Remember, continually re-iterating this process is essential in how to measure sales enablement effectively and efficiently. It’s all about that cycle of “measure, analyze, improve” we mentioned above.
Qualitative vs. quantitative sales enablement metrics
Sales enablement metrics fall into two categories:
- Quantitative Metrics
These are numerical indicators of efficiency and effectiveness. They measure specific outcomes like lead conversion rate, deal closure rate, average deal size, and sales cycle length. Tracking these helps to measure the tangible results of your sales enablement efforts.
- Qualitative Metrics
These, on the other hand, are insights into less tangible aspects of sales enablement or observations, such as customer satisfaction, product knowledge among the sales team, and improved selling techniques, which provide context to the numerical data. Collecting this data helps to understand the experiences associated with your product, team, or sales process.
Both types of metrics offer unique insights into your sales enablement strategies and can help guide your team towards more effective sales and marketing activities.
Qualitative sales enablement metrics include
- Check-in Surveys: Gathering feedback from your new team members at set intervals in their onboarding journey (like 30, 60, or 90 days) could offer you critical insights. These insights enable you to refine existing sales enablement programs.
- Proficiency in Specific Sales Processes: Depending on the current objectives of your organization, you might want to assess proficiency in certain sales activities — especially when there’ve been recent changes. These metrics are instrumental in identifying areas to focus on, like say, forecast accuracy.
- Demo Proficiency: Particularly in the tech/software sector, ensuring your sales team is proficient in demos is vital. Monitoring demo skills becomes even more crucial, inviting one-on-one feedback helpful for a qualitative analysis of sales enablement metrics.
- Level of Confidence: Regularly gauging your sales team’s confidence levels, both newcomers and veterans, and the progress in learning new tools, methods, etc., is fundamental.
- Tool Adoption: Your investment in tools to support your sales team needs tracking. With most sales teams implementing two or more new technologies last year, a significant part of your role as an enablement professional is to ensure these sales tools are adopted and used effectively.
- Knowledge Retention: Use sales enablement tools to quiz your reps on what they’ve learned and retained. These can reveal gaps in knowledge, guiding you to create additional resources and foster skill development. This could be a quantitative metric looking at submission rates, average scores, and pass rates.
Qualify and score leads automatically
with Dashly AI chatbot to close more deals
and raise key metrics
Sales Enablement Analysis: Most Important Quantitative metrics to Consider
As you create an analysis plan, it’s important to keep the following factors in mind so you can measure your sales enablement metrics against them:
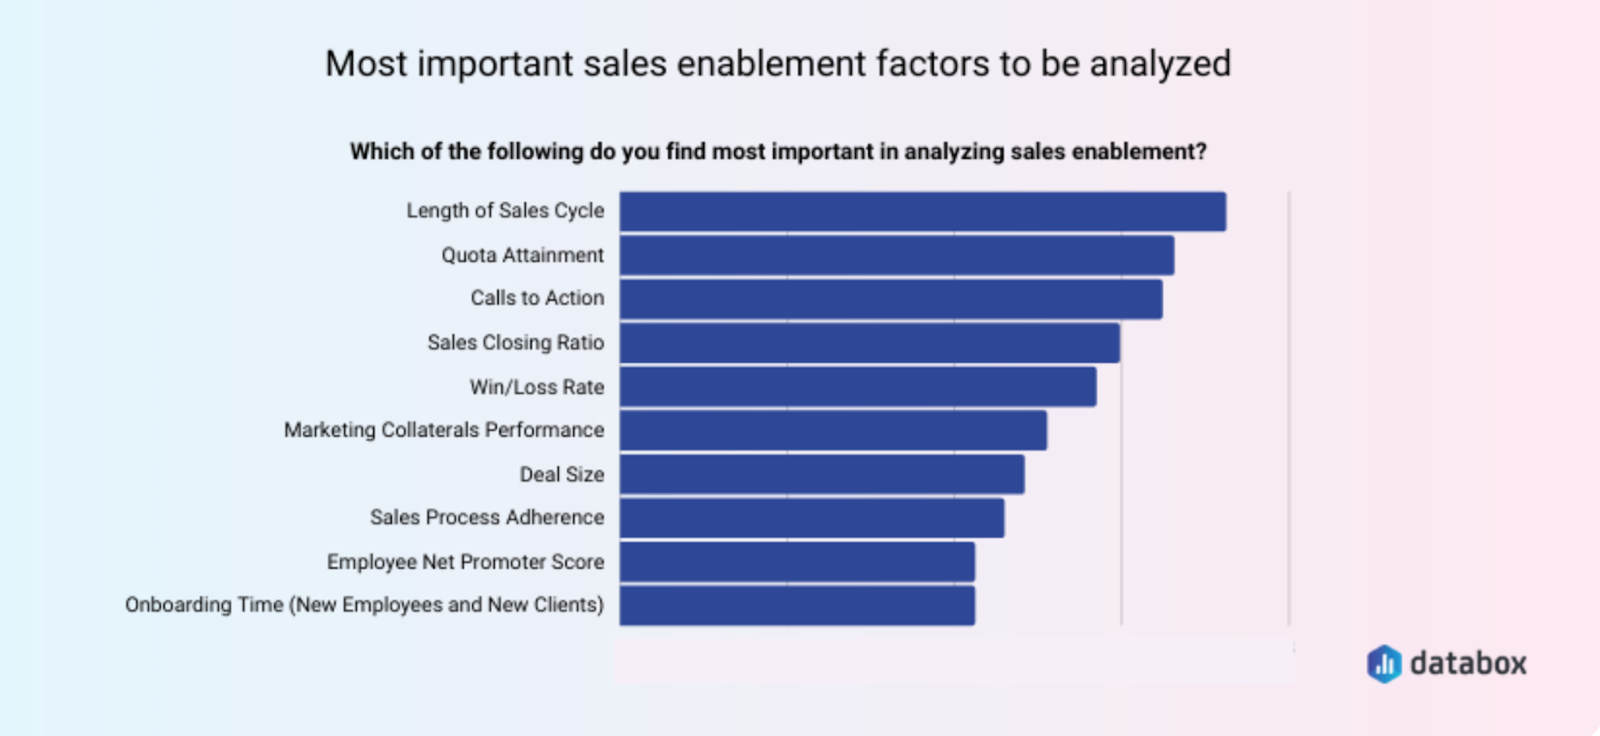
- Length of Sales Cycle
This metric measures the average time it takes for a lead to become a customer, tracked from the initial contact to the finalized sale. It’s calculated by dividing the total length of all sales cycles (in days) by the number of closed deals.
This metric helps understand sales efficiency and informs about market trends and buyer behavior. By calculating this metric you can locate the bottlenecks in the process, and work on speeding it up.
- Quota Attainment
This is a measure of how close your sales reps come to meet their target goal in a set period. It’s a key performance indicator (KPI) that reflects the sales team’s productivity. Measuring the quota regularly can aid in identifying potential issues, be it lack of training or knowledge, and correcting them promptly.
- Calls to Action (CTA)
These are prompts on your website that guide visitors towards your goal conversion, like signing up for a newsletter or scheduling a demo. The efficiency of a CTA can be measured by dividing the number of successful actions by the total visitors. This metric is particularly important for marketing to assess the effectiveness of different CTAs and tweak as needed.
- Sales Closing Ratio
This metric is the number of deals won divided by the total number of opportunities. It helps you understand how many prospects your sales team needs to hit their targets. Track this metric over time to ensure sales efficiency and effectiveness.
- Win/Loss Rate
This indicates the percentage of opportunities that are won (closed-won deals) and lost (closed-lost deals). Insights from the win/loss rate guide the sales strategy and planning for future periods.
- Marketing Collateral Performance
This tracks how well marketing assets (e.g. guides, case studies, blog articles) are contributing to the sales process. This can be measured by tracking downloads, shares, or attributed sales. Effectiveness of marketing collaterals is a valuable sales enablement metric to understand which content drives sales.
- Deal Size
You can measure it by dividing the total revenue by the total number of closed deals in a specified period. Understanding average deal size helps manage revenue expectations and plan sales strategy accordingly — make sure your marketing and sales teams cooperate, creating hypotheses and scoring leads together.
- Sales Process Adherence
This assesses the degree to which your sales team sticks to the prescribed sales process. The clearer the process, the easier it is for the sales manager to follow through, and the better it is to calculate the results of the deal later. It is best measured using a qualitative assessment or tracking usage of sales tools and methods.
- Employee Net Promoter Score (NPS)
This captures the willingness of employees to recommend their workplace to others, ultimately, their satisfaction with what they do. High eNPS often correlates with motivated sales teams, translating into better sales performance. The score is calculated by dividing the percentage of those satisfied with their job (promoters) by the percentage of those that aren’t (detractors).
Read also:
👉 10 Amazing Benefits of Sales Funnel to Boost Your 2025 Strategy
👉 B2B Marketing Sales Funnel Strategies That Drive Results
- Onboarding Time
This measures the time it takes to get a new employee or customer up to speed with the product or process. This correlates with the quality of provided materials (product guides, onboarding manuals, etc.). Minimizing this duration by refining existing processes increases sales productivity and customer satisfaction.
- Meetings Set
This reflects the number of sales meetings arranged in a particular period. If your model depends on such meetings, this measure can indicate prospect interest and the efficiency of your initial outreach.
- Opportunities Created
This quantifies the potential deals that have been identified by your team, providing a pipeline for potential revenue. Most sales teams use CRMs nowadays, and so the number of opportunities can be leveraged simply by making the most out of the current CRM in use. Built-in processes like lead qualification can help your team to score deals with the clients who are most likely to arrange a meeting and purchase the product.
- Time to First Deal Won
As the name suggests, it measures how long a sales rep takes to close their first deal. It’s an indicator of how effectively they are trained and onboarded, so, essentially, it shows whether other processes in your company are built well and efficiently.
- Sales Pipeline
This tracks all opportunities and stages they’re in, offering a snapshot of potential revenue and predicting short and long-term sales. A well-built sales pipeline can also help to estimate the number of deals your team is likely to close and within what time period.
- Lead-to-Customer Conversion Rate
This is the percentage of leads that convert into paying customers, showing the effectiveness of your sales funnel and identifying leaky points in the conversion process.
- Employee Churn Rate
This metric shows the rate at which employees leave your organization. A high churn rate can indicate disengagement among your sales team, most definitely impacting performance. Achieving your goals at a predictable rate is going to be a tall task if your team members are constantly churning — so keep an eye on the amount of pressure and workload managers are under.
Tracking the right sales enablement metrics brings visibility into the effectiveness of your sales and marketing practices, and provides key insights for refining your enablement strategies.
Qualify and score leads automatically
with Dashly AI chatbot to close more deals
and raise key metrics and raise key metrics
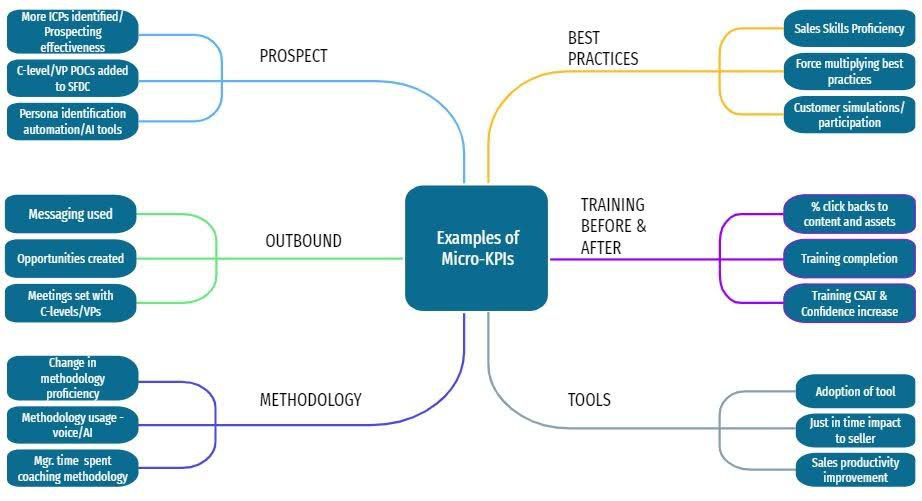
Sales enablement micro-KPIs
While most businesses are aware of the major sales KPIs (Key Performance Indicators), honing in on micro-KPIs and objectives allows for a more granular evaluation of your sales operations.
- Micro-KPIs in sales enablement provide a granular understanding of your sales operations, essentially focusing on specific operational elements.
- A sales KPI (Key Performance Indicator) stands for a numerical data point used to track the performance and progress towards sales enablement goals.
For example, at Dashly, we focus on adoption tools as a part of our sales operations KPIs. We monitor how quickly and effectively our team is deploying these tools, as rapid and correct utilization can lead directly to greater efficiency and success.
Sales enablement also relies heavily on methodology. Therefore, effectiveness and consistency of methods used by the sales team are also measured, giving us a nuanced understanding of what’s working and what needs refining.
Achieving sales enablement goals revolves around evaluating enablement KPIs such as the productivity of sales reps, the conversion rate in the sales pipeline, or how well training and development initiatives are being adopted.
By focusing on these aspects of sales enablement and persistently defining KPI in sales, teams can ensure they’re continuously progressing towards their goals, offering a more meaningful interaction to customers, and driving the organization’s sales initiatives to new heights.
6 Most Important Sales Enablement Metrics You Should Track
At Dashly, we focus on 6 key sales enablement metrics.
These ones proved to be the best sales metrics for our SaaS B2B scenario:
- Sales Cycle Length
- Sales Closing Ratio
- Quota Attainment
- Onboarding Time
- Target Completion
- Conversation to Close Ratio
- Sales Cycle Length: We track the average time it takes for a lead to convert into a customer. Short sales cycles can indicate efficient sales processes, which is pivotal for SaaS companies like ours.
- Sales Closing Ratio: This is the proportion of leads that become customers. It helps us track the effectiveness of our sales team and identify areas to improve.
- Quota Attainment: How often the sales team meets their set targets is closely monitored. It helps us gauge the overall success of our sales function and steer clear of stagnancy.
- Onboarding Time: The time taken to get a new client proficient with our system is critical. Quicker onboarding equates to a superior customer experience and quicker product utility.
- Target Completion: This metric measures the percentage of set targets that are completed. It’s a direct reflection of our overall performance.
- Conversation to Close Ratio: This measures the average number of interactions needed to close a deal. It helps us enhance our sales tactics to streamline the process.
We primarily focus on these metrics to maintain our sales efficiency, serve our customers better, and improve revenue — aligning perfectly with our overall sales tactics and marketing endeavors at Dashly. We believe putting the right metrics to practice can positively impact your workflow and prove the value of your sales team processes as well — go ahead and give it a try 🙂
Boost your lead conversion
into a call by x3
with Dashly AI chatbot
FAQ
What are sales enablement objectives?
Sales enablement objectives are defined goals intended to boost sales performance. These typically include enhancing sales efficiency, shortening the sales cycle, improving revenue growth, increasing deal size, and boosting the overall proficiency and productivity of the sales team. They focus on equipping the sales team to provide value in every interaction with the customer.
What are metrics in sales enablement?
We’re talking about quantitative benchmarks used to assess the effectiveness of strategies and operations within a sales team. They include sales cycle length, deal size, win rate, quota attainment, onboarding time, lead conversion rate, and sales productivity, among others, enabling continuous improvement in sales processes.
What are leading indicators in sales enablement?
Leading indicators in sales enablement are metrics that provide early signals about the likely success of your sales process. These may include new leads generated, conversion rate at each stage of the sales funnel, engagement with sales materials, and progress of sales rep training or onboarding.
How do you measure success for enablement?
It can be measured by assessing the increase in competency, efficiency, and knowledge application in performing tasks or roles, alongside the achievement of set objectives.
What metrics determine the success of a sales team?
You need to pay attention to metrics such as revenue achieved, sales cycle length, deal size, customer acquisition costs, customer satisfaction scores, and quota attainment rates.
What are sales metrics?
These are data points that represent a sales team’s performance, including revenue, sales volume, conversion rates, customer retention, deal size, and speed of sale cycle, helping to strategize and achieve sales goals.
Read also:
- What is sales enablement? Definite guide + Strategy + Tools for 2024
- Top 13 sales automation tools to propel your sales strategy
- Harnessing the power of AI sales enablement: 5 strategies to transform your sales process
- 10 steps to building a sales enablement strategy in 2024
- 7-steps guide on how to create an automated sales funnel in 2024: examples & tools
- 7 sales enablement best practices to empower your team and boost performance
- 10 sales enablement tools: Best software to grow your team performance
- Guide on sales enablement team structure: 10 roles and responsibilities
- Mastering sales automation: A comprehensive guide to best practices and tools
- Sales and marketing automation: How to align their workflow to 2x revenue [Dashly example]
- Guide to sales funnel optimization: best tips, tools, and common pitfalls
- 10 inspiring sales funnel examples to boost your business growth
- Mastering sales funnel analysis: step-by-step guide, tools, and examples


![12 best AI marketing tools to automate EVERYTHING [expert edition]](https://www.dashly.io/blog/wp-content/uploads/2023/10/12-best-AI-marketing-tools-to-automate-EVERYTHING-expert-edition-720x317.png)