Customer Service KPIs

If your work is related to customer service, you’ll agree that it’s hard to measure customer satisfaction. In Dashly, we are also confused about this and want to find out how exactly we can find out that our customer service works fine or needs to be improved. And find ways to make it even better, surely.
We are not the first ones who come with such a question. This is why many customer service KPIs were developed — to give a quantitative assessment to customer satisfaction. In 2020, there’re lots of them. Obviously, it’s difficult to find those which suit your company in this diversity.
What KPIs should be used to measure customer service efficiency, and how can we affect them? How to improve these KPIs? These are the main questions covered in this article.
Why you should pay attention to your customer service
Imagine a small online shop. It’s completely OK when their prospects don’t understand how to process the purchase, if customers want to check their order status, or at least return their order. In all listed situations, they will write or call the support center and ask their questions.
In case this online shop has a customer support team that helps prospects complete their order and help if they’ve made a purchase.
Customer support team would give a clear explanation and do everything to help the prospect finish their order. Maybe clients will even tell their friends how great the customer service team was. The chance of retention increases, as well as the chance of acquiring more clients.
Great customer service allows you to save current customers and acquire new ones.
Now, let’s find out which KPIs we can use to measure the support team’s efficiency and how to improve this.
Disclaimer: you shouldn’t use all the KPIs we mention. The best strategy is to choose the most relevant KPIs for your industry and your business. Otherwise, you risk running after two hares.
Customer Satisfaction Score (CSAT)
I guess you all evaluated your satisfaction with some company at least once.
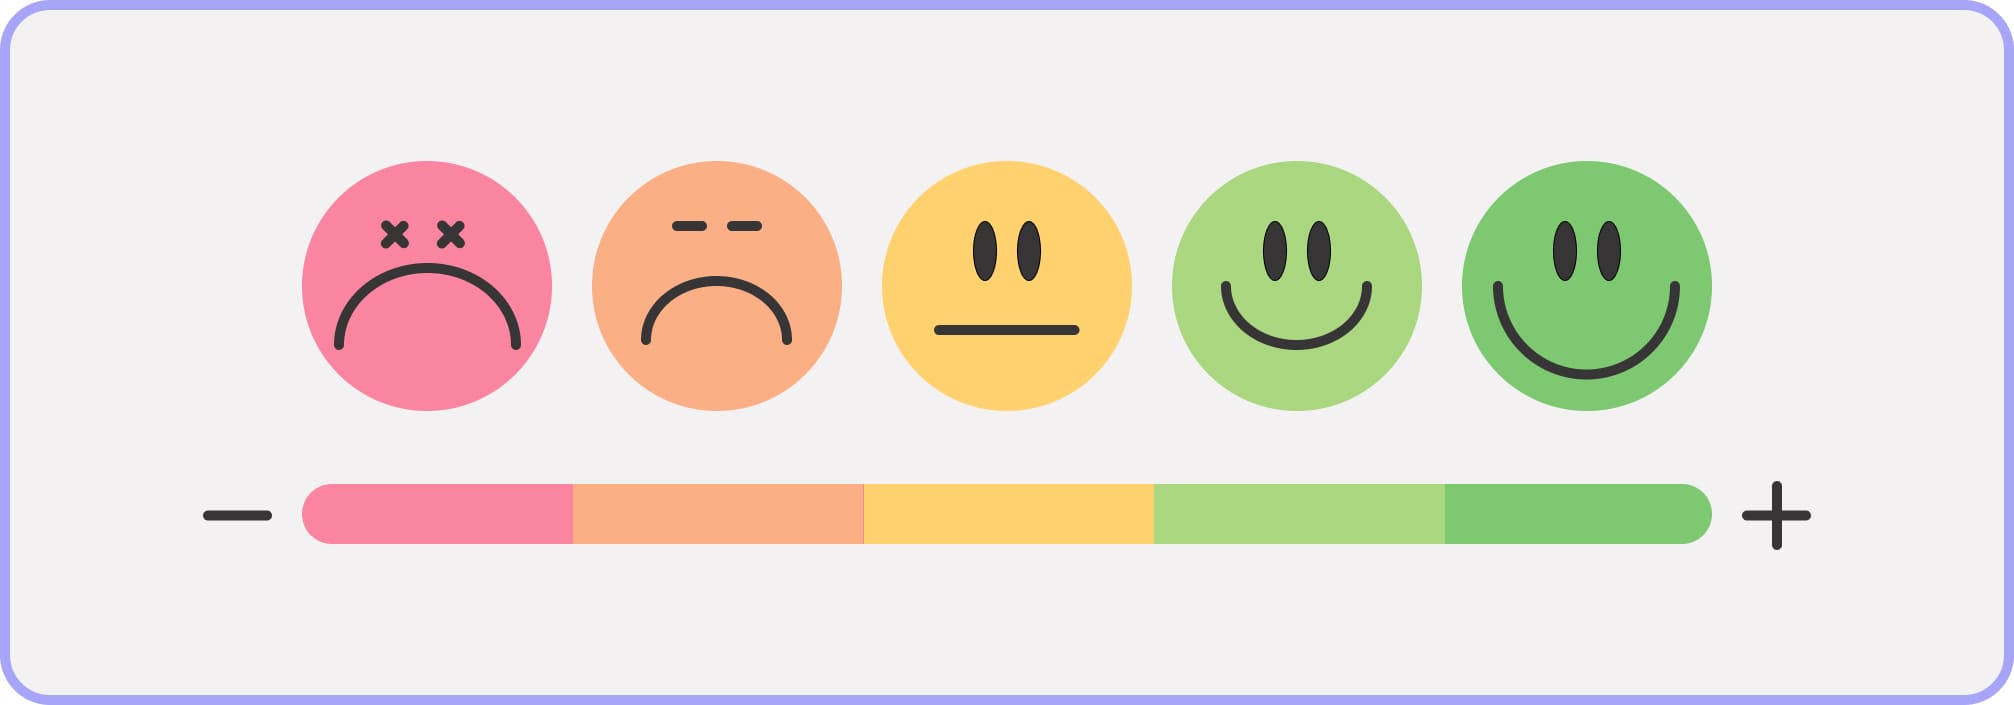
One of the most popular and easiest ways to measure customer service is to measure the customer satisfaction score. This means that you directly ask your clients if they liked the customer service they’ve had. Usually, CSAT is measured on a scale from 1 to 5, where 5 is totally satisfied and 1 — not satisfied at all.
And here is the formula you can use to calculate CSAT:
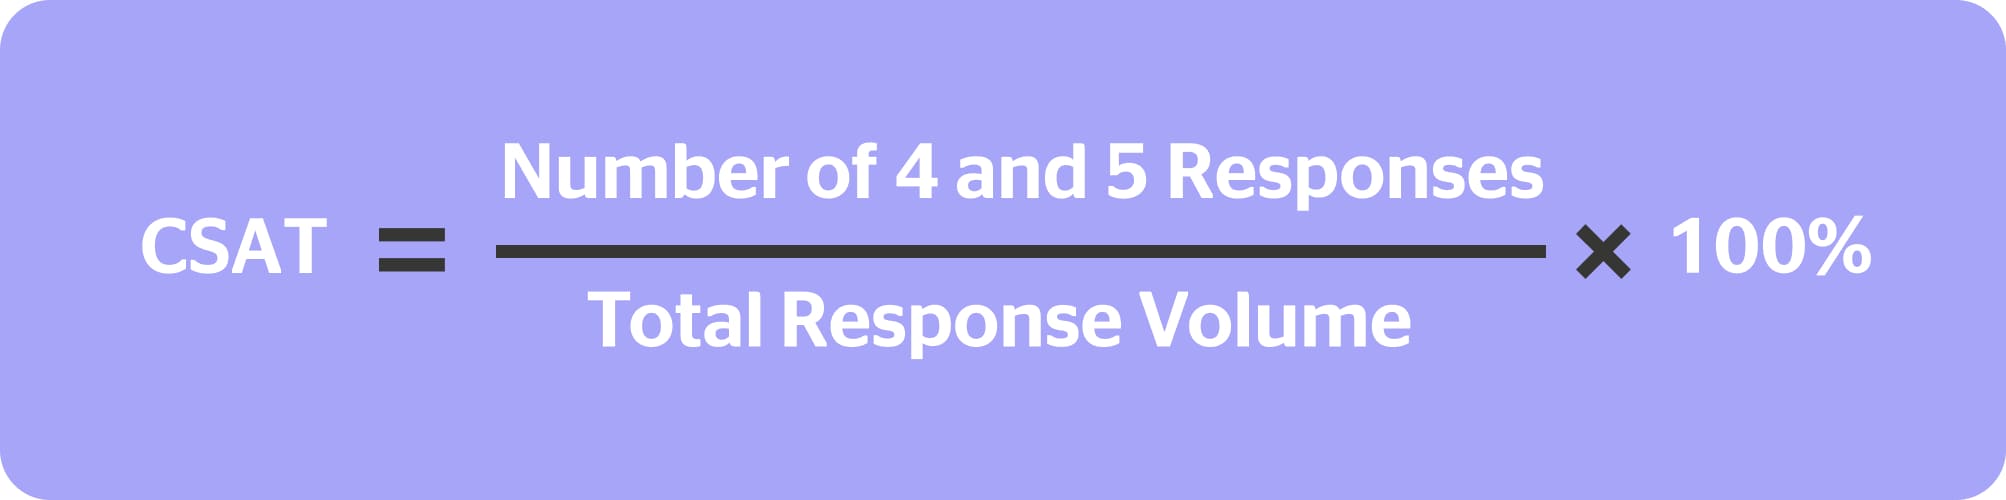
This can be easily implemented into your website: just send this survey when your agents close the conversation. This way you’ll get qualitative data on how much your customers are satisfied with your customer service.
How to set the key performance indicator for agents
Definitely, this metric of KPI will vary from industry to industry, but on average this shouldn’t be less than 80%. This means that at least 4 out of 5 customers should be happy with your customer service. Otherwise, you need to work on your customer service quality.
How to improve it
Find out what exactly went wrong. To do so, listen to the phone calls or read live chat conversations. In case there are no insights, conduct an interview or a survey: ask users what they didn’t like about the experience with your customer service.
In Dashly, we set KPI on the CSAT. In case the real number is less than in the KPI, we review the conversations with bad scores and look for what exactly affected the bad score. Next month we pay extra attention to this parameter and improve it.

Churn Rate
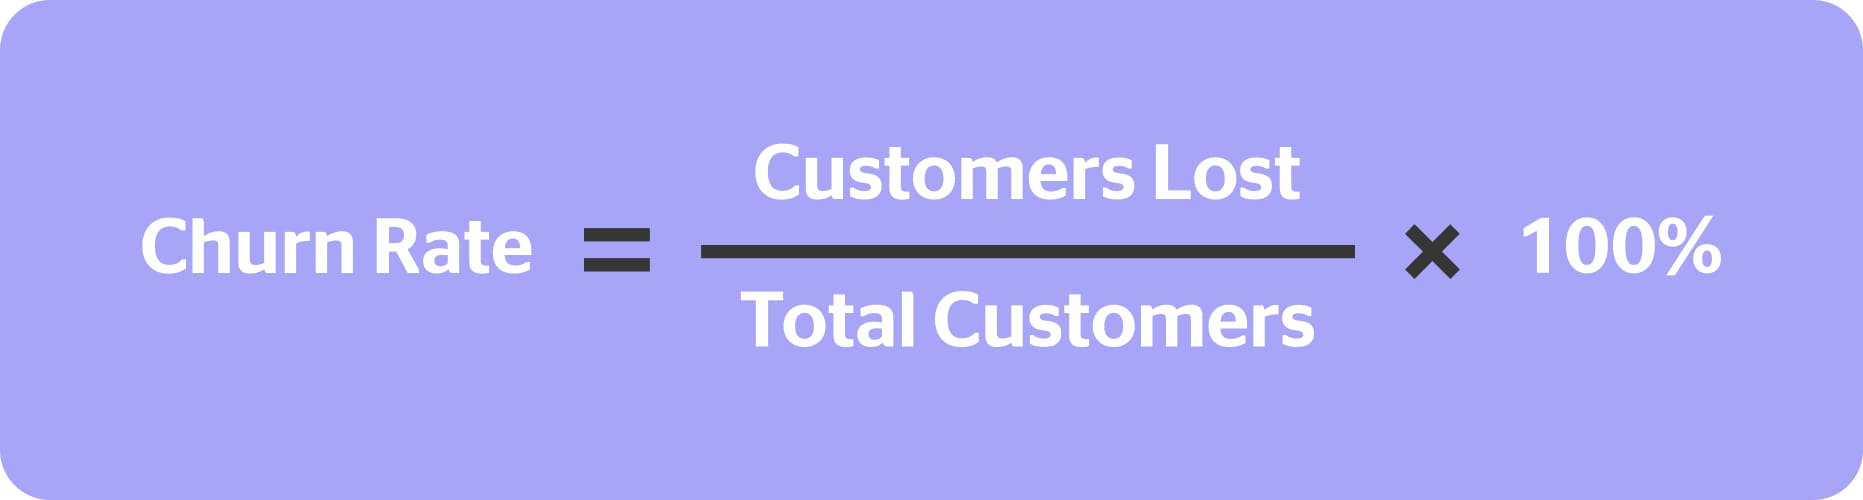
Generally, the churn rate is the number of users who left during the given period. They do not buy your product or cancel their subscription. This is the KPI used almost by every company. Here is the way you can calculate the Churn Rate:
Let’s consider an example. Imagine this month you’ve lost 73 customers. And let’s say, at the end of the month your client base counted 1166 clients. Here is the way you can count your churn rate:
Churn rate = 73/1166=0,06, equals 6%.
Simple? Definitely!
How to set the key performance indicator
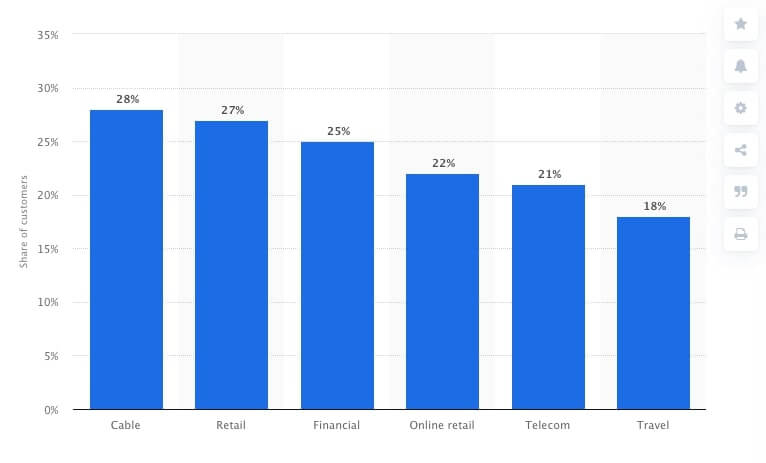
It’s difficult to say what churn rate KPI is good for your business. It would be fair to say that the churn rate KPI depends on the industry. For example, below you can find the average churn rate by industries report provided by Statista:
How to improve
Your customer service can directly affect the churn rate. Agents can help users resolve their problems, help with setting up, explain something, and so on. Also, support agents can reactivate some users by delivering the value of your product.
Actually, there are several ways to work on the churn rate reduction. For example, stay notified about churning customers in real-time. This will help you react as soon as possible and increase the chance or user reactivation.
In Dashly, we also work on the churn rate. First, we think of what changes were in customer service during the period. If there were no changes, we try to understand what changes in the product (e.g., pricing, new features, and so on) may affect the churn rate.
Again, talk to your clients. You may ask your customer support to communicate with those who churned. This way you can get magnificent insights, resolve the problem, and maybe reactivate lost users.
By the way, here is our article on how to detect early signs of churn. The post will help you understand whether the user is going to churn and prevent this.
Retention
This metric shows how many customers are coming back after they churned. In other words, it’s the number of people who continue using your product over the period.
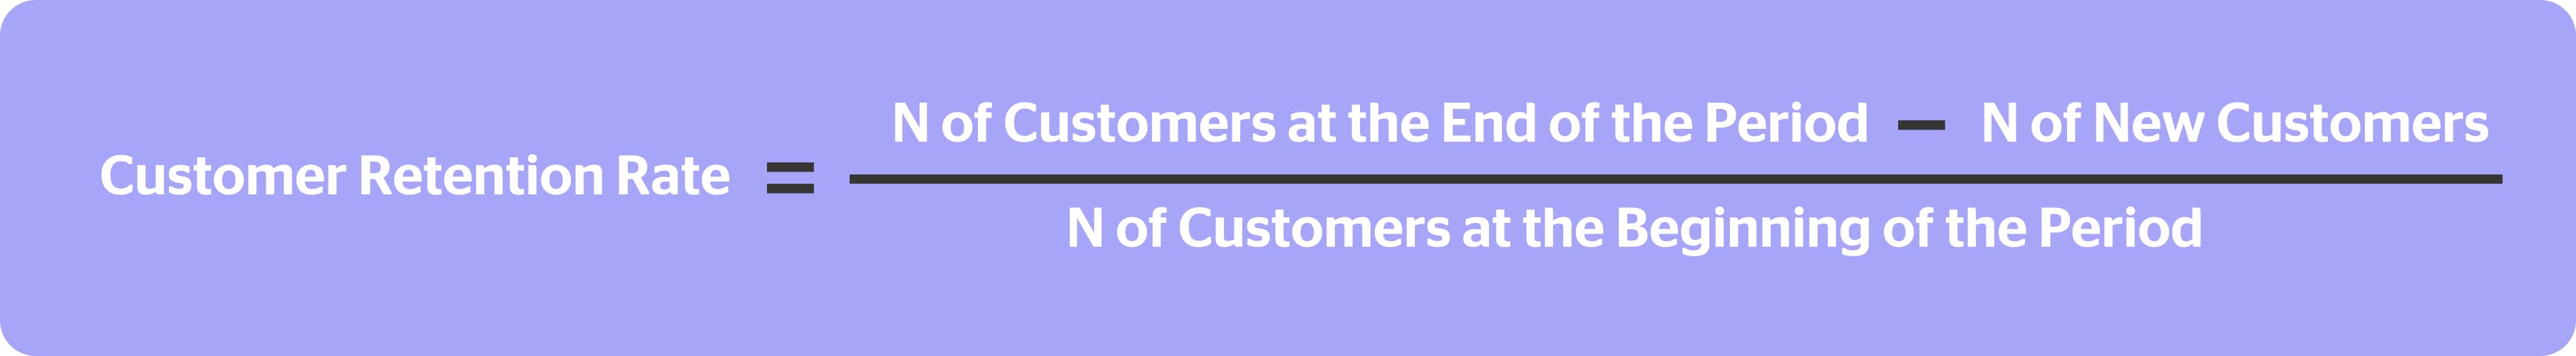
Let’s take an example. In September, your sales reps attracted 53 new customers. You know that at the beginning of September you had 1130 clients, and at the end of September you got 1155. Then, what Retention Rate did you have in September?
Retention Rate = (1155-53)/1130=0,97% or 97%.
In case your retention rate equals 97%, your churn rate is 3%. This is quite a good result.
As we said, churn is a normal process at every stage of every business. But it’s always better to return churned customers than to acquire new ones. Forbes says that retaining churned clients may be five times cheaper than attracting new one. Isn’t this a reason to work with the retention rate KPI?
How to set the key performance indicator
It’s obvious that the better your support team performs — the bigger retention. But keep in mind 5 to 25 rule: that even a 5% increase of customer retention may enhance your revenue by up to 25%. So, your KPI may be actually to reach a positive retention trend.
How to improve it
Work on your reputation. Work on your brand image on social media. Customers are more likely to stay with you when you’ve established a strong relationship with them. Listen to your customers on social media and work on complaints — people love when brands hear them.
Call your clients when they churn. This way you’ll find out the reason they left and at the same time will try to come with the solution to their problem. There is a big chance that they’ll change their mind.
For example, we did the same and got an exciting result:
Recently, we ran an experiment. One month we didn’t call our churned users and didn’t ask them why they left. Next month, we called every single churned user. The number of reactivated accounts went up by 63%!
Agents’ first response speed
The agent’s response speed is the time that your agents take to reply to the client’s request. The time that the prospect has been waiting for the reply affects the first impression of your company. The longer the prospect has to wait, the less probability that your customer will come to you again. This is why you should be careful about this metric.
How to set the key performance indicator
The phrase ‘the less is more’ is exactly about this KPI.
According to Liveagent, the average user expects that you will answer them in the chat is 2 mins 40 seconds. But actually, the KPI on agents’ response time varies from industry to industry and from company to company. For example, here is the average response time by industries from the Live Chat Benchmark Report:
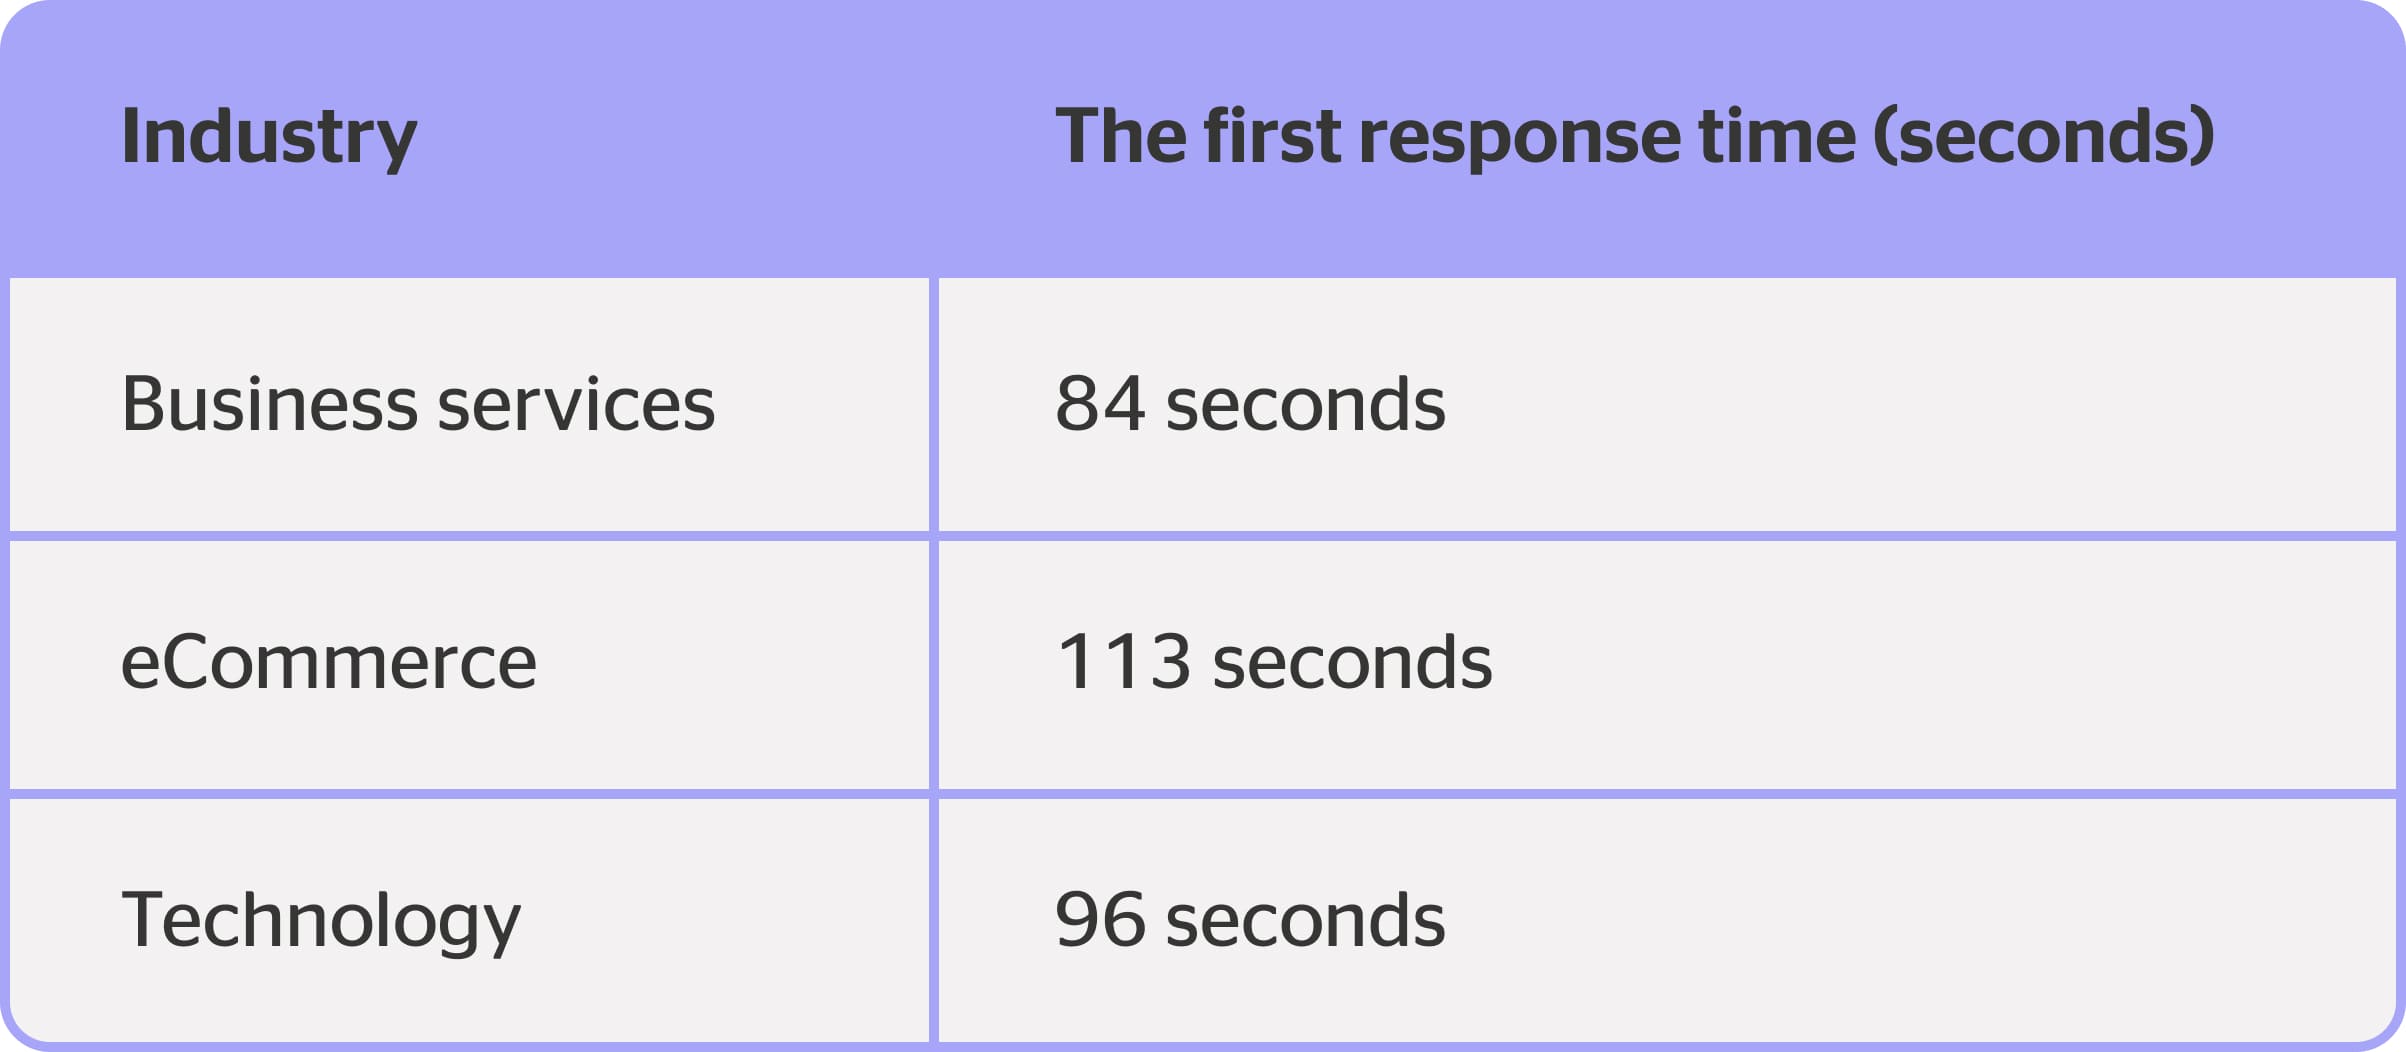
NB: the response time in live chat should be less than in a call center or in social networks by default. Originally, the live chat goal is to reduce this ‘time gap’ between the customer and the agent. And sometimes only reply in the chat holds a customer back from finishing the purchase. So, reduce the response time as possible.
How to improve
There are several ways to work on this KPI.
The first one is to hire more agents in case your workload is too heavy for the current number of agents.
But it’s always better to optimize the work than to hire more specialists. Find the most ‘hot’ hours when your agent receives many requests, and the periods when agents are less loaded. Then, just distribute agents’ work hours based on these statistics.
For example, if your hot hours are from 1 P.M. to 4 P.M., 4 agents can serve the chat. From 10 P.M. to 1 A.M., when the workload is the lowest, only one agent may be there to reply to all the conversations.
Also, agents may use additional resources to be more effective when replying. The knowledge base is a good solution: agents don’t need to write the same instructions and guides each time but can send the knowledge base article instead. Also, agents often use saved replies to answer repetitive questions.
And of course, the chatbot will make sense. Just send a simple ‘Hi, what can I help you with’ — even this message will be better than nothing.
Average handling time (AHT)
This is the average time an agent spends in the chat resolving the customer’s request.
Here is the AHT formula:
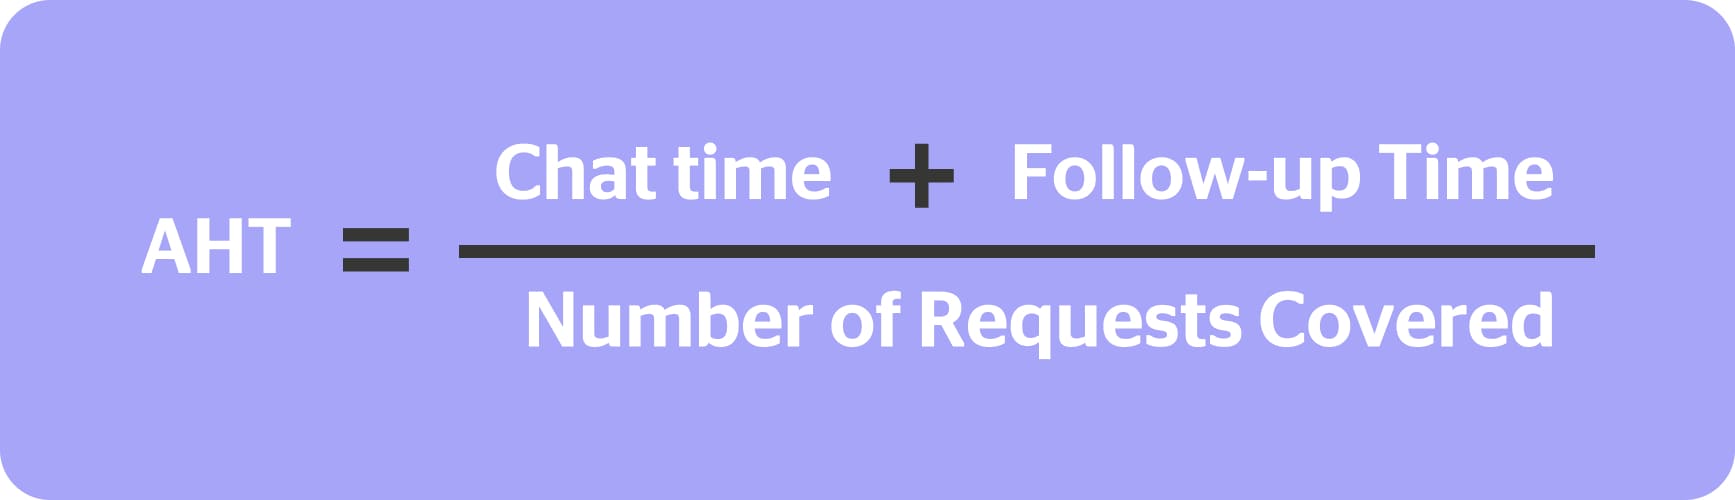
where:
- Chat time is the time spent in the support channel,
- Follow-up time is the time that is spent by the agent on resolving the customer’s problem (e.g. searching for the answer in the internal knowledge base),
- The number of requests is the total number of people that have written to you during a given period.
Say that an agent spent 10 minutes in chat writing an answer to the customer’s question and 5 minutes on seeking for this answer in the knowledge base.
Then, holding time equals 10+5=15 minutes.
Let’s consider a more complicated example. You know that your support team spent 1500 mins in the chat in total. Therefore, the chat time equals 1500 mins. Also you know that agents spend about 7 minutes to find the required information on average, and this month you’ve had 250 conversations e.g., the total follow-up time will be 1750.
Then, Average holding time = (1500 Chat minutes +1750 Follow-up minutes)/250 conversation=13 minutes.
How to set the key performance indicator
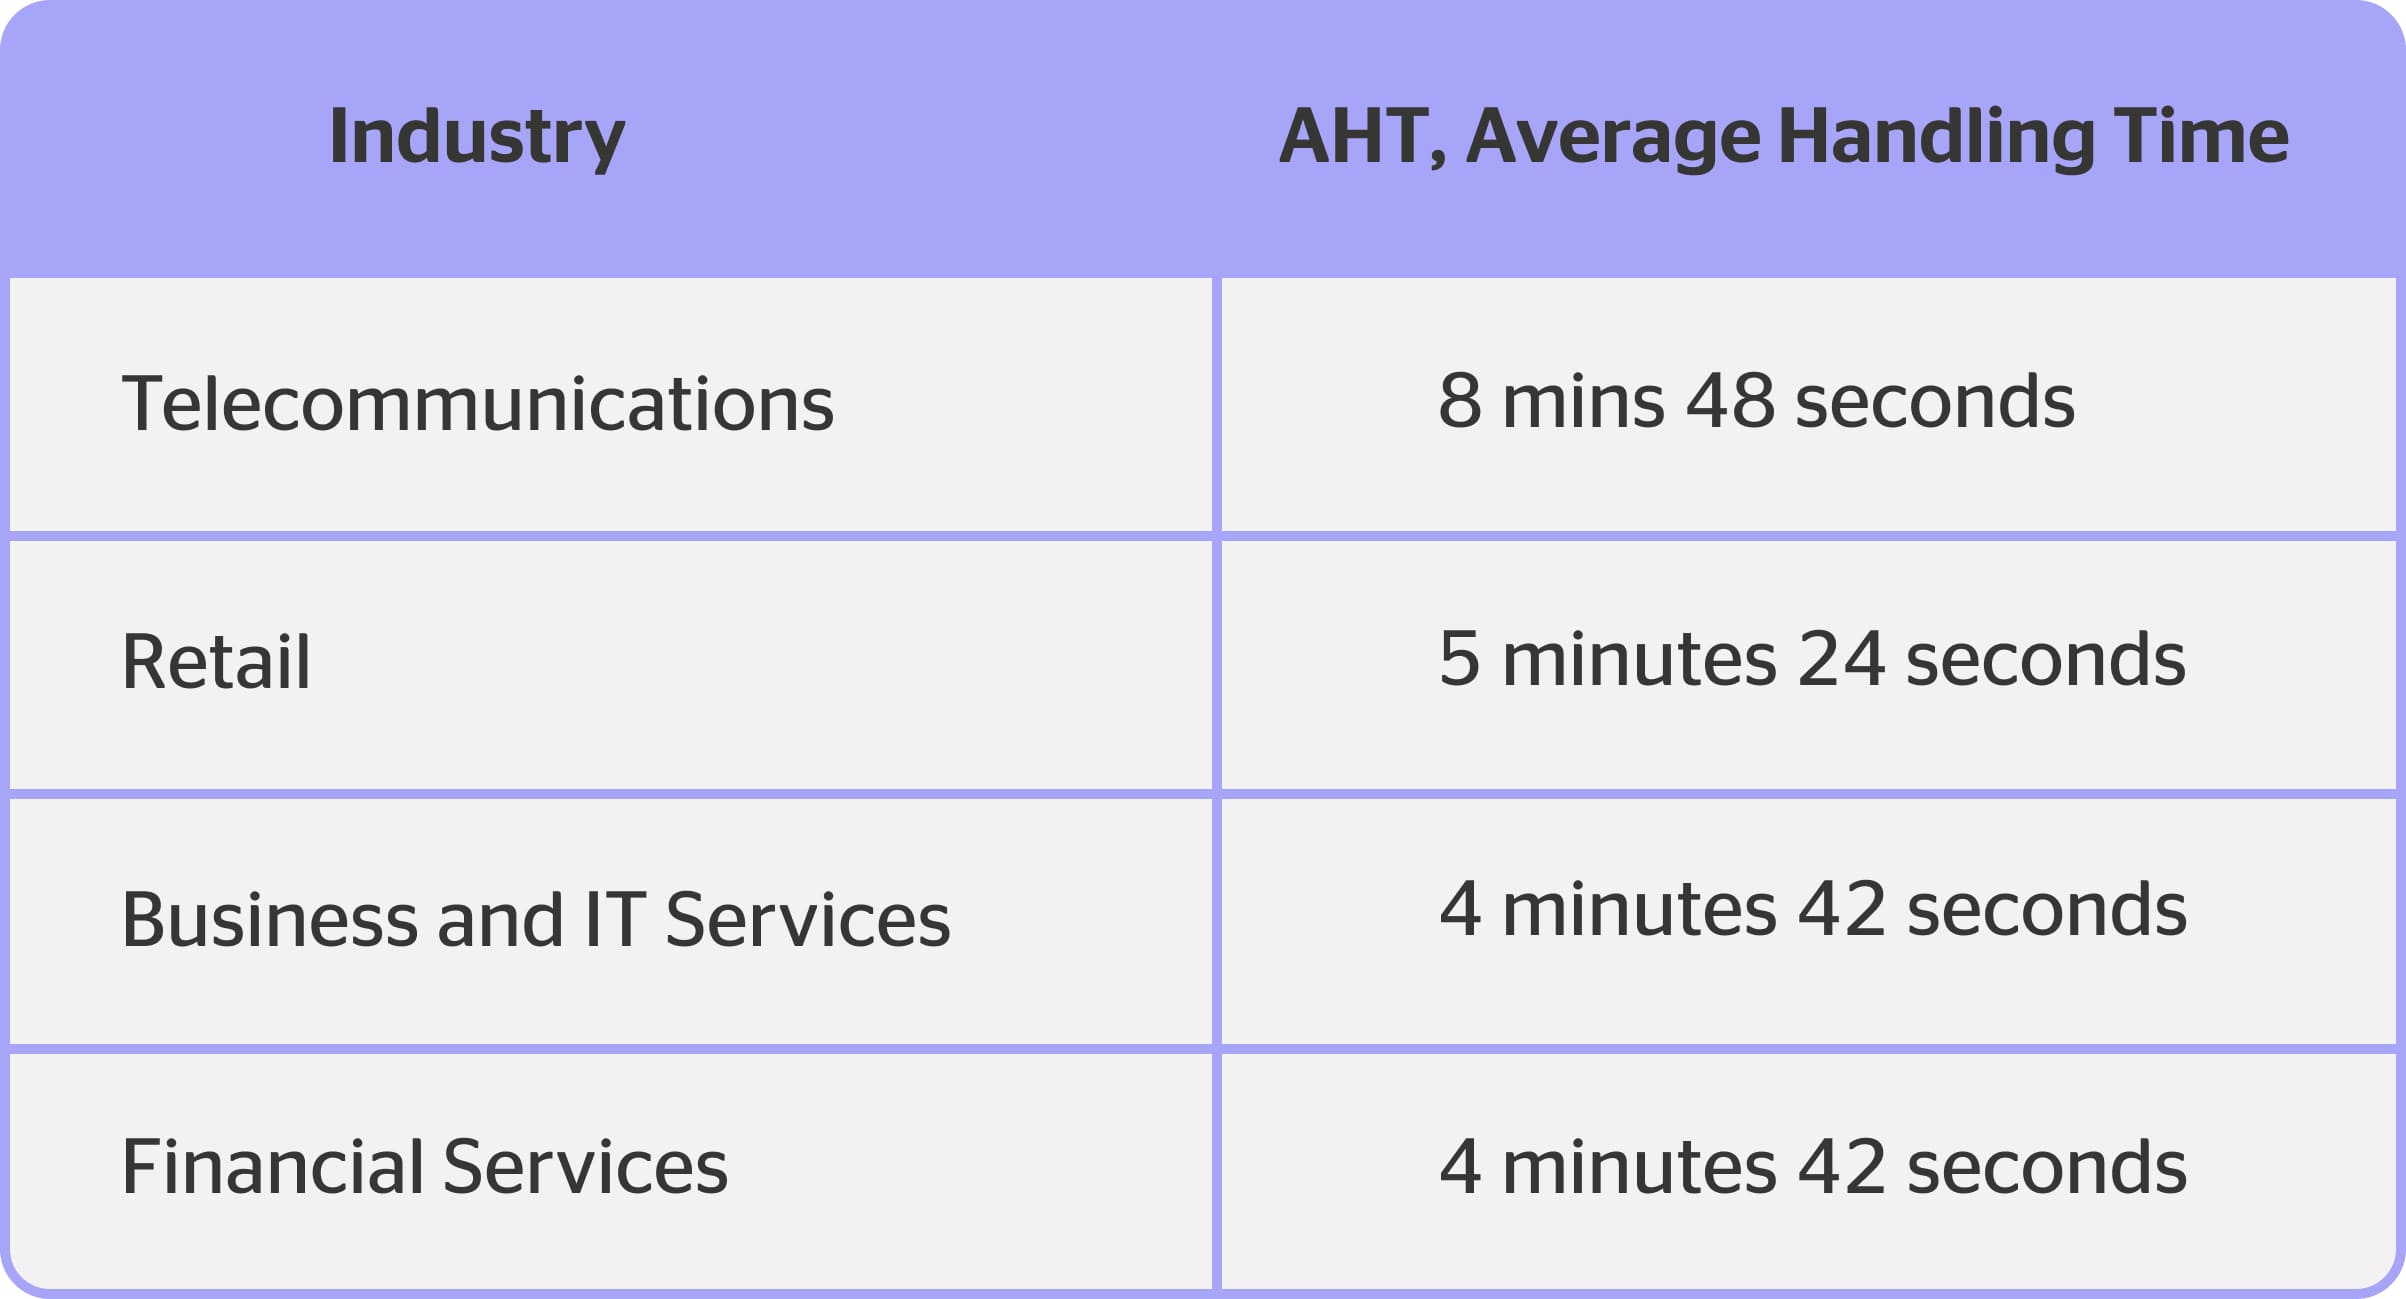
According to Callcentrehelper, the average AHT is 6 minutes 3 seconds. Again, this is an average number for all businesses. Here are more concrete numbers for some industries that may become your KPI:
How to improve it
To work on Average Handling Time KPI, try to distribute all the conversations by channels. This way right agents will catch the right conversation and resolve the client’s question faster.
Create a knowledge base. I’ve already mentioned this tool in this article. The knowledge base will help agents find an answer to customers’ questions several times faster. What’s more, they can simply send the link to a knowledge base article instead of writing the same instructions again and again.
Create saved replies. These also will help you save agents’ time on typing such messages as ‘Hi! To connect a new module, click…’ and improve KPI. You may just create the most typical replies and send them whenever needed in 2 clicks. This will save not only time but agents’ nerves as well 😉
Net Promoter Score (NPS)
NPS is one of the loyalty metrics that shows how likely your customer is to recommend you. This also one of the most popular KPIs. NPS is calculated by asking your customers if they’re likely to recommend your product to their friends or other people who may be potentially interested in it.
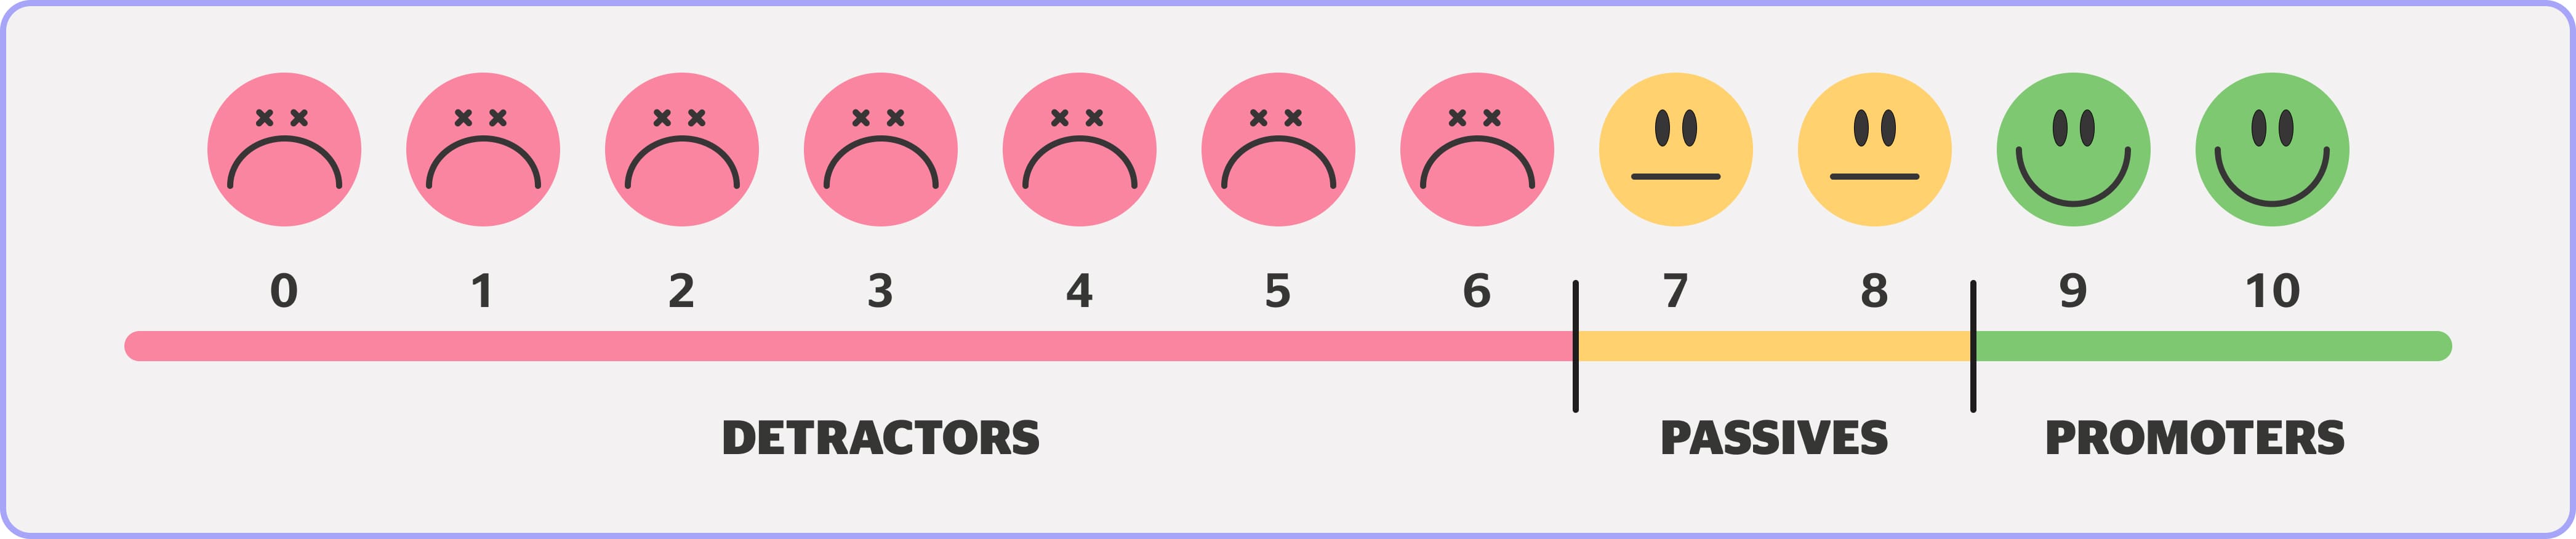
The NPS indexed from -100 to 100. But usually, companies ask a customer to evaluate the willingness to recommend their company on a scale of 0 to 10:
- If the customer puts from 0 to 6, they are the so-called ‘Detractors’, and the probability that they will recommend your product is low, but vice versa they are likely to criticize you. These people are not satisfied with your product.
- Passives are those who put 7 or 8, and they’re indifferent about your product. Generally speaking, they’re satisfied with your product but may be caught by your competitors. They won’t recommend you, but also won’t say anything harmful to your reputation.
- Those who select 9 or 10 are Promoters — truly satisfied customers. These are people who will tell the world how great you are. And your task is to make this segment as big as possible, eliminating the first group of customers.
NPS also allows you to evaluate your company word-of-mouth: if your product is promoted by your own clients. This is free, and that is why this type of promotion is one of the most desirable by CEOs.
NPS has its cons: you can’t get ultimate data just because you can’t force all your customers to respond to your survey. There is a big chance that you’ll get an answer only from dissatisfied ones or vice versa only from Promoters. This distorts your data and makes it harder to understand a sore point of your product.
How to calculate NPS after getting survey results:
After collecting a relevant number of answers, count how many answers you’ve got from each category of customers: Promoters, Passives, Detractors.
The next step is pure math: you need to subtract the number of Detractors from the number of Promoters and divide this by the number of all the respondents. Here is the formula:
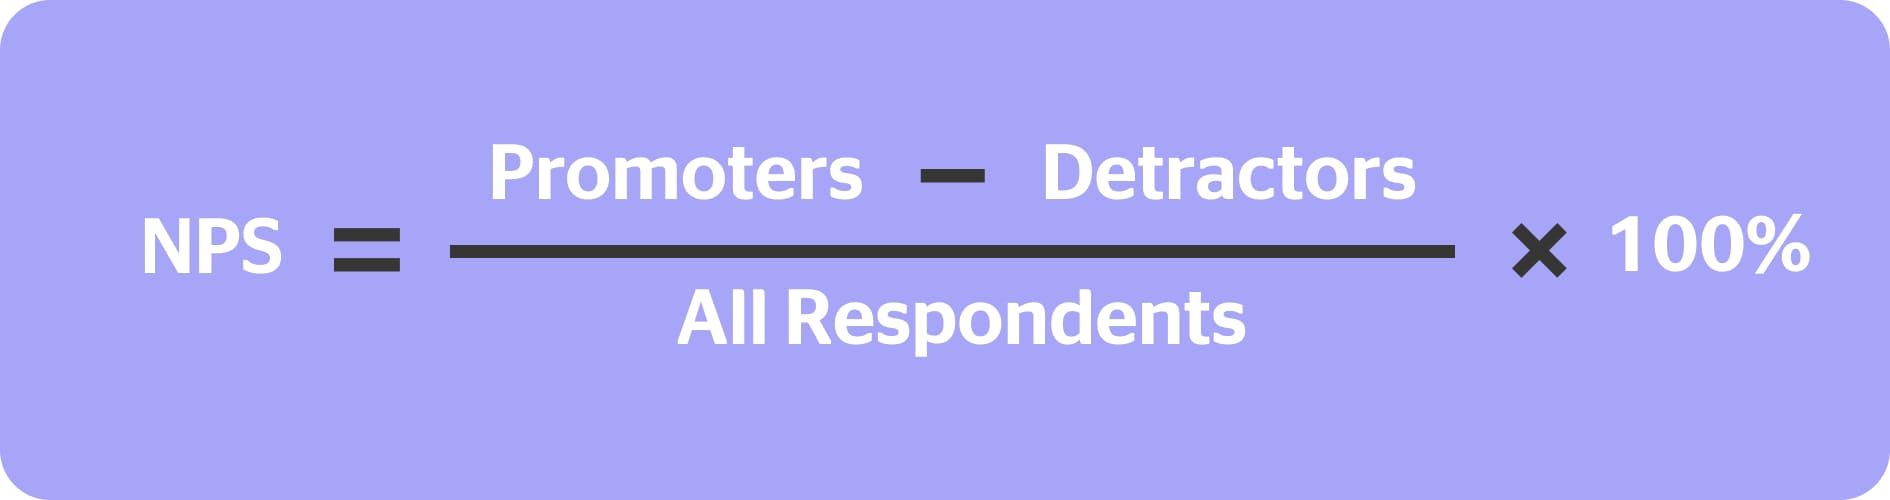
For example, let’s imagine you have 1000 users. You’ve conducted a survey on NPS and found out that 430 people are Promoters and likely to recommend your product to their friends (they’ve put from 9 to 10 in the survey). 610 users are Passives — they evaluated the possibility from 7 to 8. And all the other 60 customers are Detractors — they’re dissatisfied with the product.
Then, what’s your NPS?
NPS = (430-60)/1000 = 0,37, or 37%.
How to set key performance indicator
Anyways, how can a support team KPI help to increase your company NPS?
Again, there is no all-size-fits-all benchmark. However, here is average NPS for several industries:
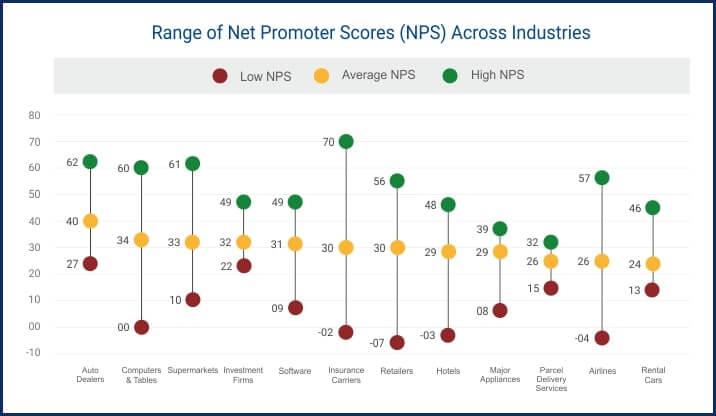
Also, the number of Detractors should be less than the number of Promoters.
A good NPS score is one that is better than the last
How to improve
Conduct annual or bi-annuals surveys on NPS. In case you do them too frequently, there is a big chance that people won’t respond or will put a bad mark.
Write case studies with detractors and promoters. You don’t need to publish them, but this way you will understand bottlenecks and find out causes which made the client put you an Excellent or Bad mark.
Dig into numbers. For example, a year ago, Distractors may have put you 1-3, but now the average mark by Distractor is 5. You won’t see this change in NPS, but it is. This will help you understand whether you move in the right direction or not.
Follow up your prospects. It’s said that 77% of customers appreciate companies that ask them for feedback. This increases brand loyalty, and, consequently, NPS.
Another good idea is to talk to Promoters and ask some of them to share in their social media why they love your product for some benefit. This may help you eliminate some Distractors, grab some more loyal customers, and increase your KPI.
Customer Effort Score (CES)
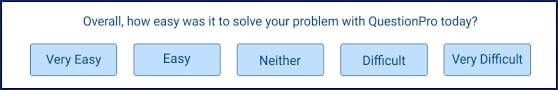
Customer Effort Score is a KPI metric developed to find out how customers evaluate their experience after they’ve got assistance. Did they get the answer to their question? Did they have to seek for some additional info to resolve their problem even after an agent sent them instructions? Was everything clear to them? CES is developed to find answers to these questions.
This typically sounds like ‘How easy it was to resolve your question? ’, and usually this ranks from ‘Very easy’ and ‘Very difficult’. CES is usually measured on a scale from 0 to 10, or from 1 to 5.
How to set key performance indicator
In case customers say that they’ve faced some problems with interacting with your customer support, definitely it means that you have something to change. The fewer obstacles your customers face while resolving their problem, the more loyal to your company they are. But how to understand that the number of complaints reached the critical number?
According to QuestionPro, if your CES is less than 70% (e.g. less than 7 out of 10 had a positive experience with your customer service), there is room for improvement. But these are average numbers for all the industries.
Note that a single CES does not give a lot of information about the customer experience. You need to conduct NPS surveys to measure customer loyalty and effort at the same time. Your client may be loyal to your company while having bad customer experience last time. So, you should pay extra attention to these cases when analyzing.
How to improve it
Train your support agents. Be sure that they’re doing their best to help customers. For example, try to systemize all the theoretical information that is used by agents. This will be much easier for them to find an answer to the client question and give a brief instruction for the solution to the problem.
We’ve written a detailed article about live chat agents training, check it out here.
Work on bad feedback. Always pay attention to customers who are dissatisfied with your customer service: create Google Sheets with all your objections, create Notion page, or use Miro. Brainstorm on all the objections listed. This is a great source of insights, thrust us.
Customer Lifetime Value (CLV)
This metric shows how much value a customer brought to your company during your relationships. The longer the relationships are, the higher the Customer Lifetime Value of a single customer is.
This metric will show you how much money you’re able to spend on customer acquisition as maximum.
To calculate Customer Lifetime Value, you need to count all the costs that you’ve spent to acquire a customer, and all the revenue they’ve brought to your business. Then, paste these numbers in this formula:
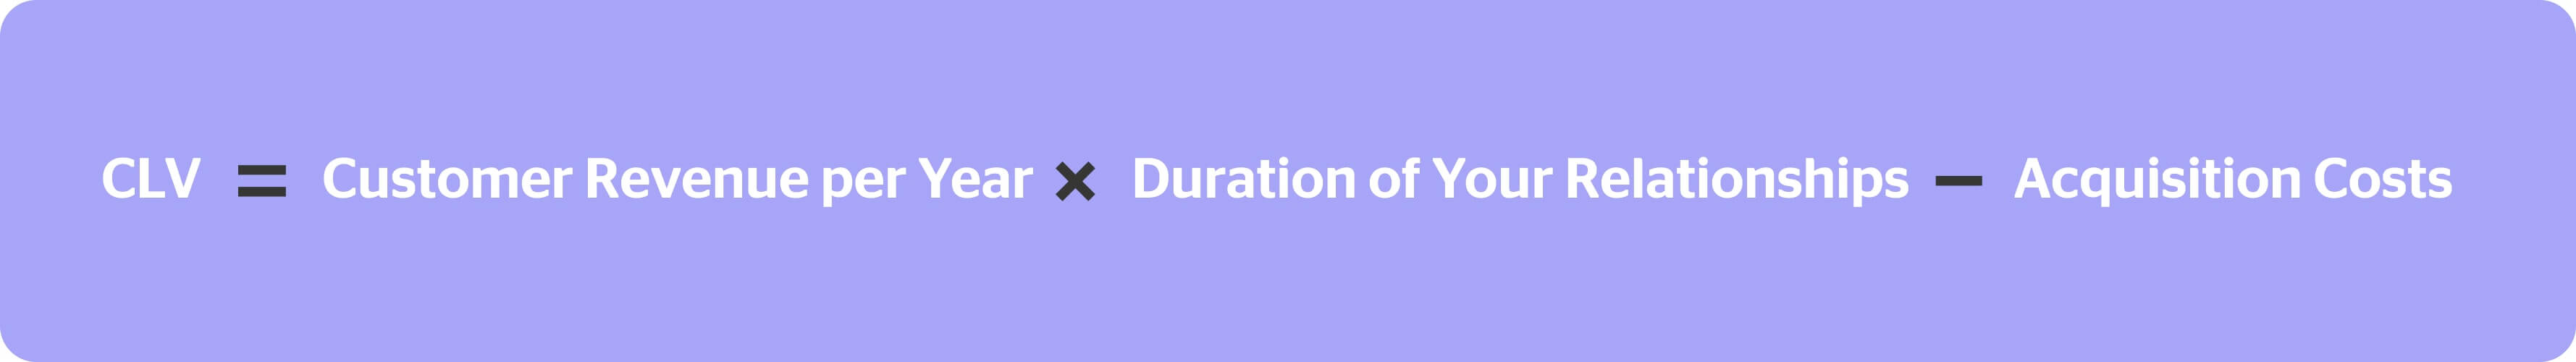
As an example, let’s imagine that one of your customers uses your products for 7 years and annually brings $360. Then, we remember that the marketing campaign cost $1000 and attracted 5 new clients, therefore the acquisition cost for this client was $200.
Thus, CLV = (360*7) — 200 = 2520 — 200=$2320
How to set key performance indicator
There is no unambiguous answer, but David Skok, says that the Customer Lifetime Value (LTV) should be at least 3 times greater than Customer Acquisition Cost (CAC). So, this may be used as the KPI.
It is said that CLV should be considered with the Customer Acquisition Cost (CAC). An ideal ratio CLV to CAC is 1:3 — your ideal customer must bring at least x3 more revenue than you’ve spent on their acquisition.
How to improve it
Always ask churning customers what dissatisfied them. This way you will have a chance to return them or prevent such cases in the future, and reduce your churn rate.
Establish an omnichannel model. Omnichannel means that your customers will be able to connect you and make a purchase through different channels, not only from the website. This is especially important for B2C businesses, as omnichannel helps clients interact through different platforms.
Segment customers and invest mostly in those who are interested in using your product. For example, you may use ABCDX segmentation and find out what types of customers bring more value to your business, and pay extra attention to them.
Summing everything up
I told you about the most popular customer service metrics. But remember what I said at the very beginning? Let me remind you: you don’t have to use all these metrics to analyze your customer service.
The trap many customer support leaders fall into is trying to measure too many things, and by doing so, diluting the significance of the important ones.
Study, test, and combine them. Each business and each industry is unique and requires different ways to measure success. Only by sampling, you will find the best solution.
Stay tuned and love your customers!


![Customer service automation: complete guide for SaaS teams [2026]](https://www.dashly.io/blog/wp-content/uploads/2025/05/cusotmer-automation-guide-720x317.png)