The 7 Key Email Marketing Metrics & KPIs You Should Be Tracking

How do you know that your emails are effective and bring you more benefit than harm? In this article, we’ll tell you which metrics are used in email marketing, which of them are more reliable, in what cases each of them should be important to you, and, most importantly, how and with what tools you can influence them.
We’ll be talking about 7 basic metrics:
- open rate,
- click rate,
- click-through rate,
- conversion rate,
- bounce rate,
- unsubscription rate,
- spam reports.
In order to understand which of them you should focus on, you need to clearly define the goals of each of your email campaigns. It is preferable to do this before you start sending emails ☺
The objectives of email campaigns can be very different: lead generation, increased involvement, increased loyalty, conversion of leads to clients. Your task may be to inform about service updates or, for example, emails can be sent to generate repeated sales or avoid abandoned shopping carts. Most importantly, remember that your goals and objectives will not necessarily be exactly the same as those of your competitors, and more importantly, they will not always be the same, which means that in each case you need to monitor different indicators. And it is best to track them in dynamics, that is, over time.
For example, if your goal is to increase engagement, you should pay attention to the click rate; if your main goal is to inform, you can be guided by the open rate; if you turn leads into customers, then the key metric is conversion rate.
The important point is that the principle of “One email, one goal” should be followed. Otherwise, you can get fewer clicks or even more complaints. And of course, not all emails, as well as all other content, should be selling. When building email communication with customers, you need to present yourselves well, that is, competent and caring, rather than fussy and intrusive.
Now, let’s elaborate on each metric one by one.
Thanks! The first email is already in your inbox

Open Rate
How is it calculated? Very simple.

The open rate is the most obvious, but not the most reliable indicator. Of course, it’s good if it’s high, and it’s bad if it’s very low. According to the data published by Mailchimp, the average Open Rate across all industries is 20,81%. Hubspot claims that, according to their data, the average rate across all industries is 32%. Usually, 20% is considered the norm.
Image blocking often embedded in email clients makes Open Rate an unreliable indicator. The point is that an email is only considered open if an image has been downloaded. Therefore, it often makes no sense to compare Open Rate with other indicators.
But tracking its dynamics, for example, for weekly emails (to the same contact list) is another thing.
If you still want to compare your performance with your competitors (although the click-through rate is more appropriate), you should consider that the average Open Rate is very different in different industries and focus on the average for your industry. In addition, Open Rate depends on the frequency of emails, and the optimal frequency varies between large and small companies.
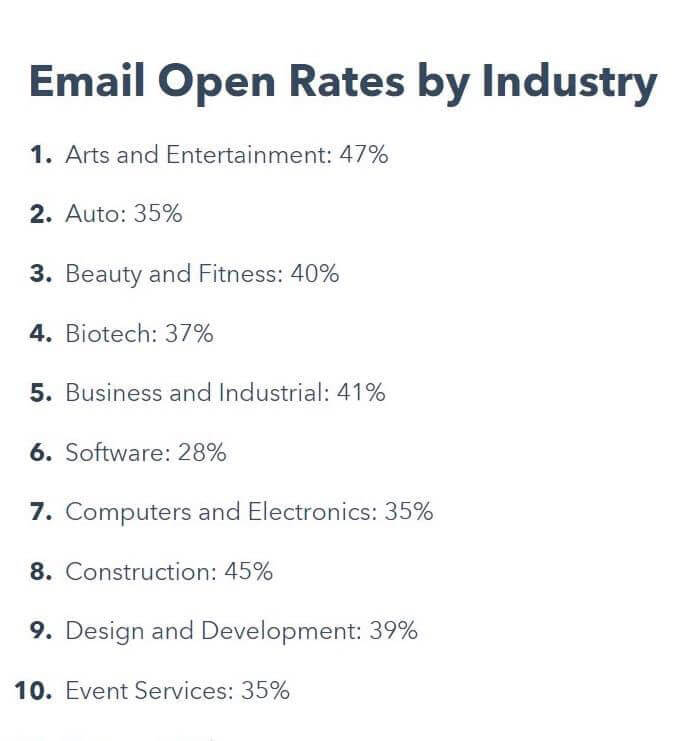
Open Rate allows you to find out how relevant the email is, what topics your subscribers are interested in, and when it is best to send emails. By tracking this indicator, you can also see how recognizable the sender is and whether it’s worth adding a company name to the email subject.
Email marketing is basically an excellent field for experimentation and a tool for studying audience behavior. The easiest way to increase Open Rate is to come up with an email subject so that as many users can open it as possible. But don’t forget, firstly, that you shouldn’t manipulate openly, and secondly, that the email content should match the subject and should not disappoint those who opened an email.
Inside Intercom almost always comes up with great email subjects:

You can use numbers (and offer something useful like cases):

It works well to mention a discount or promo code in the email subject.
For example, like this:

Here’s a good example of a succinct but attractive subject of a welcome email:

And this, for example, is too much:

Don’t write in an upper case that there’s a “DISCOUNT!!!” in an email.
Here’s another email you’ll never open. It’s unclear who is from, what it is about, and after all, the preheader is so bad here:

Never use unclear abbreviations in the email subject and the sender field. Don’t forget the preheader.
According to the statistics, emails containing the recipient’s name in the subject are being opened 26% more frequently. But at the same time, the content of the email should be personalized based on the data about the user and their behavior (otherwise it will not work out).
If the open rate is too low (and you send emails more than once a year and not every day) and you have experimented enough with the subject matter of the emails and the sending time, it may be worth trying to segment the audience more carefully.
Over time, after running tens and hundreds of A/B tests, you will derive some of your own formulas ☺
Click Rate
Clicks are technically a more reliable indicator. And a more important one.
Because normally, when we create an email, it’s the clicks that we want to get. Clicks indicate the interest of the audience in the emails; this indicator reflects well the effectiveness of individual elements of the email: headlines, text, buttons.
How to calculate the Click Rate?
Here’s a simple formula:

The Click Rate takes into account all actions with emails inside a mailbox. This is how it differs from the Click-through Rate (also often referred to as Click-to-Open Rate), which in turn only takes into account the actions taken by those who opened the email, i.e. it measures the performance of the content within the email.
The Click Rate norm is about 4%. Although a lot depends, again, on your industry, the level of competition in it and how narrow your target audience is that you have chosen (the narrower the target audience, the higher the click rate of your emails should be).
Click-through Rate or Click to Open Rate
Click-through Rate or Click to Open Rate (CTR or CTOR) is the ratio of link clicks to opening emails.
How to calculate it?

This is an indicator to track and try to improve day by day because it shows how good each of your emails is, how well your email has met the expectations of your subscribers, and how interesting it has been for them. CTR is a metric that gives a clear insight into how many people from your base are really interested in your brand or your offers.
According to the open data of Mailchimp, the average CTR across all industries is about 12%. But first, this is an average figure for different industries, and second of all, for different companies (from giants to small businesses). If you have segmented your audience well, it should be high enough, up to 30%. If subscribers open emails but don’t click on the links, you should make every effort to fix this.
First, deliver your promises to preserve your credibility. If you promised to show how your team lead strikes the Universe Destroyer Pose, show it.
Second, keep the contact base up to date. New subscribers tend to be more active.
You can use pop-ups for lead generation.
At the same time, a small base of loyal and interested subscribers is better than a large list of contacts not interested in any of your offers. Therefore, based on opens and clicks, it is sometimes worth running reactivation campaigns. As a result of such a campaign, those who have not performed any activity having received a chain of reactivating emails can be singled out for a while to a separate contact list. It is necessary to send emails to this list much less often. And if these emails don’t yield any results in the long run, you can remove these contacts from the list altogether.
Third, try to make sure that what you are writing about is interesting to your customers (and not just you). Once again, remember exactly what problems people were going to solve with your product, or think about, for example, what difficulties customers may have when using your service. Help them, be attentive and helpful.
This is especially important if your product is sophisticated, and there are not so many potential customers.
Statistics prove that most often users open welcome messages (and these very emails yield more income in the end); they do so about three times more often than in the case of other emails. The average Open Rate of welcome messages is 50%. Therefore, it is important not to mess with the welcome email (or the chain of welcome emails as there may be more than one) and to think about further scenarios of communication with each lead segment. Segment your lists. Customize emails based on your knowledge of customers; personalization is super great. Customized emails generate 58% of all email marketing income.
Dashly tools allow you to completely automate emailing: segment contact base, achieve maximum personalization, and analyze results.
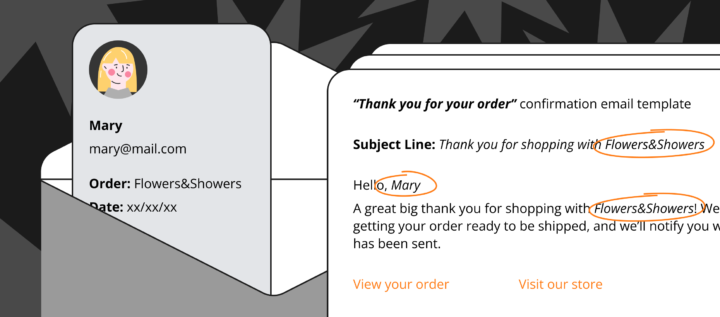
Another type of email with traditionally high Open Rate (above 75%!) is transaction emails (e.g. purchase receipts or messages about parcel dispatch). If you send such emails, think about how you can work with them: add links to additional products, a selection of similar products, personal discounts, the ability to post a review and so on; there are many options. If you do it right, you will get a great CTR, and your customers will have a pleasant experience of communication with you.
You might want to take a closer look at the statistics of opens and clicks from mobile devices. The percentage of purchases from mobile devices should increase; make sure that your emails are adapted to any screen. The CTA (call to action) button should, of course, be adapted first of all.
Well, now about the obvious. Make the email as concise as possible, and the call to action simple and clear. Add important links to the top. Make sure the CTA button is clearly visible, even if the image lock is enabled. Try to place the button in different places, use different colors, shapes, fonts, and texts.
Conversion rate
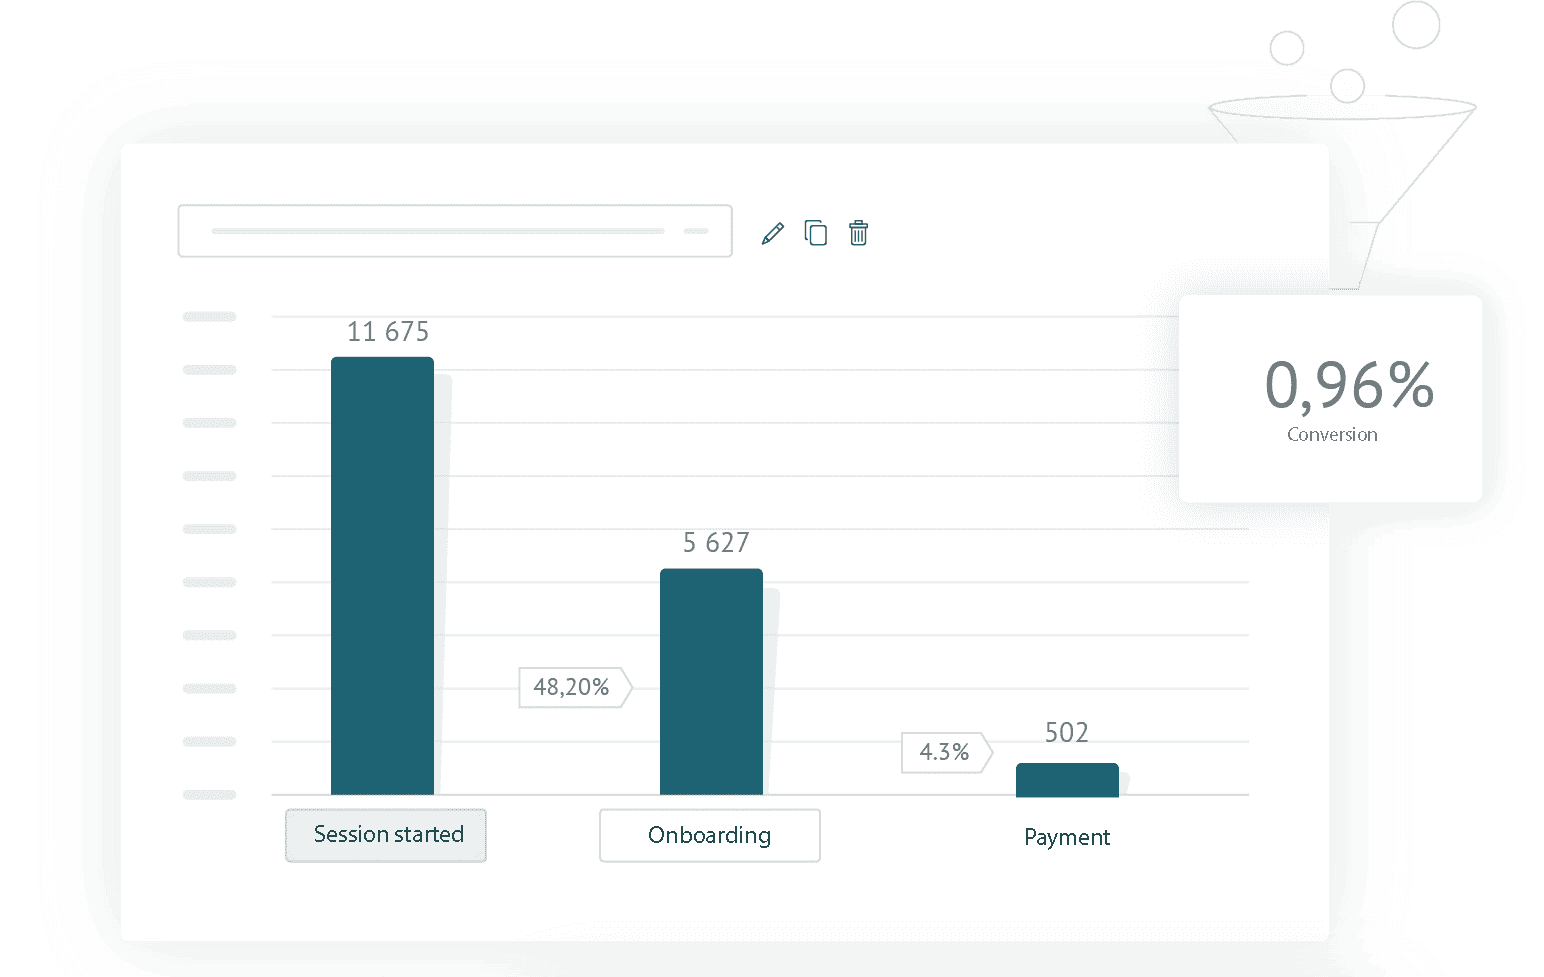
All for the sake of it (well, almost all). However, this is a priority metric for evaluating the effectiveness of email. It shows how many subscribers have performed the targeted action. Let’s say the purpose of your email newsletter is to convince subscribers to download an eBook, get a free trial, register for a webinar or buy a dress. Based on the purpose of the specific newsletter you will calculate the conversion rate.
First of all, you certainly use more than one communication channel. Your customer has likely seen the information about your service via email, then they read a recommendation from a colleague in social media networks, and then saw your advertising in the search engine and only then visited the website.
You should at least integrate the mailing system with your analytics system and track your traffic sources via UTM tags because the conversion calculation is simply not integrated into your mail services. Unlike Dashly: the service allows you to set a target action for any mailing list and determine the value of the target (including steps in between) and the speed of reaching it.
According to Hubspot, by 2019, only 23% of companies had integrated emailing with their analytics systems. You won’t be the last to do so, but it’s worth hurrying up.
Ideally, you should link all the actions of the customer from the first time they saw an ad to the purchase itself and choose the right model (or combination of several models) of traffic attribution. That is, implement end-to-end analytics.
Secondly, when analyzing the conversion rate, you should take into account the whole complex set of data including traffic quality, income, and average order value. Together with the income and average order value, the conversion rate allows you to estimate the ROI of all your email campaigns, i.e. the ratio of income to expenses.
Which conversion is considered good is up to you, based on your tasks and your expenses.
Bounce Rate
Bounce Rate is a percentage of emails that have been declined by mail servers.
Here is how it is calculated:

There are two types of bounce rate: hard bounce and soft bounce; the first one is more or less permanent, whereas the second one is rather temporary.
A hard bounce means that the mailbox is closed, deleted, or does not exist at all, and there is no chance your email will be delivered to a recipient. These addresses should be immediately removed from the contact list, as the mailing provider may consider you a spammer because of a high Bounce Rate.
A soft bounce is the result of a temporary problem with a working email address, in general. For example, a full mailbox or a server crash. In this case, the server will continue trying to deliver your email within a few days or you can try to send it again after a while. The problem may also be that the size of the letter is too large, so do not overuse pictures. In general, Soft bounce is a problem that can be solved, but it requires attention. So, if you have problems sending to the same addresses over and over again, it is better to remove them from the list.
Try not to exceed 2% of Bounce Rate, and it’s better to maintain it under 0,5% in terms of permanent emails. If hard bounce exceeds 5%, you will probably be blocked.
How to minimize bounces? Build your contact base yourself and clean it up from time to time. Confirmation of an email address in the first email (the so-called Double Opt-In) will help immediately sift out uninterested users, bots, and mistaken addresses. Send emails regularly. It is also a good idea to set up input verification in the registration/subscription form to avoid typos and non-existent addresses.
Sometimes it’s worth checking the statistics of opens by domain. You may have a problem with some particular mailing domain.
Using Dashly, you can select a segment of inactive subscribers or subscribers who have fallen into a bounce and then exclude them from the next email.
Got it! Check your email

Unsubscribe rate
It is difficult to call the unsubscription rate a reliable indicator, at least because not everyone who is no longer interested in your emails is ready to spend time opening the email and unsubscribe. More frequently, they just stop opening emails and then delete them without looking through them.
There is even an opinion that unsubscriptions are not so bad, simply because they make your base more efficient. Don’t make the unsubscription procedure complicated, rather make it as simple and easy as possible. Even if a user won’t read you, they won’t think badly of you anyway.
Anyway, a high unsubscription rate indicates a problem. The acceptable level is 1-2%. If you see a sharp increase in this indicator, look at the formal reasons for the unsubscription. And then think about why people actually unsubscribe from you.
Are you writing about something you are interested in but not your customer?
Are you writing about the same things?
Are you sending emails too often?
Has the reader only signed up for bonuses?
Is your e-mail communication not systematic enough: are you doing much about very little with random frequency and unclear targets?
In order not to lose the customer, set up a system communication with the client from the beginning: send a welcome email and manage expectations; tell them honestly what you will be writing about and how often. Consider scenarios for further communication beforehand.
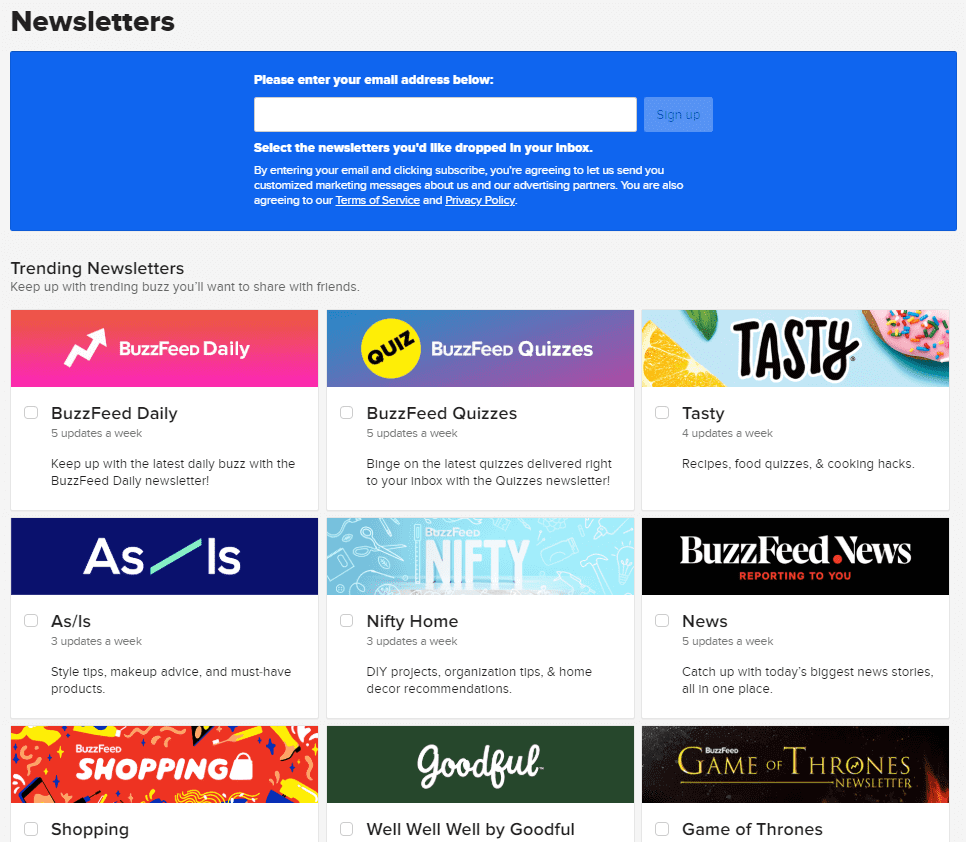
A good option is to let the user choose the type of emails they want to receive. For example, Buzzfeed does this; they have a total of 36 (!) mailing lists.
You can receive a daily email newsletter or just, for example, book reviews or the best videos with cats of the week. Or one cute dog every day (like me).
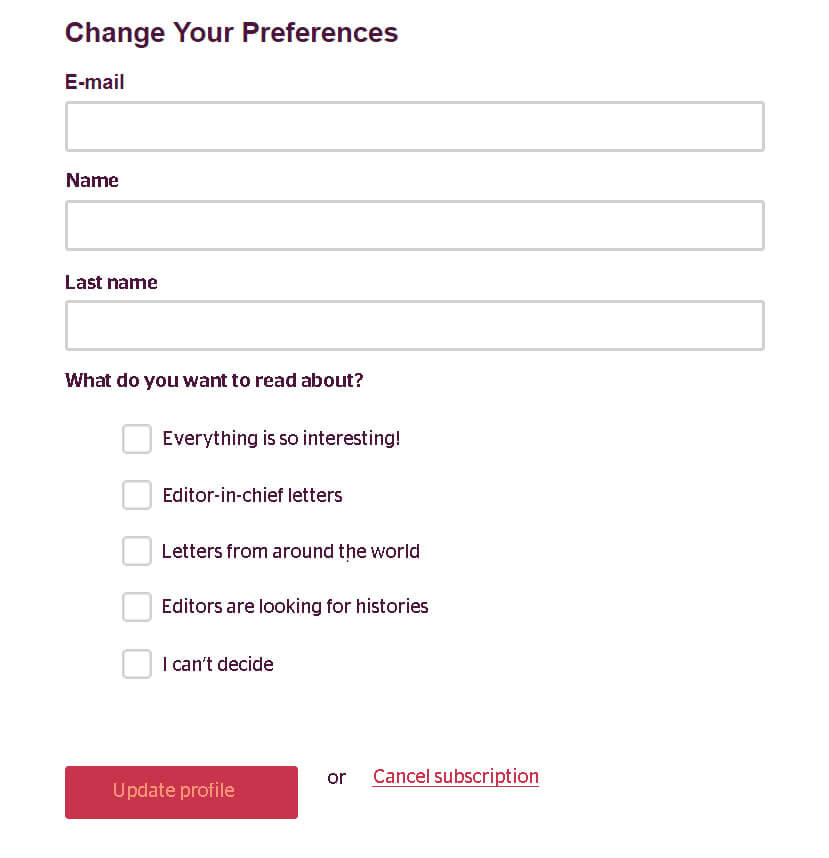
The media “Oh dear, you’re a transformer!” does the same. Though they only have five kinds of mailing lists, even this choice eliminates a lot of questions and issues.
Once again: segment your audience. Customers can be classified by contact details, channels, activity, geography, actions, and so on. You can use not only lists but also tags for the purposes of segmentation.
Spam reports
Before you send your emails, some mailing providers assign you a rating based on the number of links in the email and the spam triggers in it. Make sure that there are not too many links, and that your copywriter has learned the list of spam triggers by heart.
Make address validation from your contact base to avoid spam traps (i.e. addresses that mailing providers use to catch spammers).
Warm up your domain before you send bulk emails to a large audience.
You need to know that if the number of complaints exceeds the quota, which is 0,1% of the total number of letters sent in the last 30 days, you will be blocked.
Double Opt-In will partially help prevent complaints. No one should receive your letters without wanting to. That’s why you shouldn’t use invisible ticks when placing an order and other tricks of this kind. You shouldn’t try to build the contact base by any means as it will be much harder to build communication and most likely the spent efforts will bring you nothing but disappointment in email marketing.
If you already have problems with Spam Rate or just want to avoid them by all means, we have a detailed article about it.
If you work or plan to work with EU citizens, you must know and observe the GDPR (General Data Protection Regulation) rules of personal data processing. Here is our complete guide to living with them.
What else should you also pay attention to?
To the growth dynamics of your base. In a year, more than 20% of the base may become outdated (users change jobs, mail, lives, and interests). Which means these losses need to be compensated for.
How often are your materials reposted or published on social media?
How often do you get feedback from your subscribers?
With this data, you can recognize the advocates of your brand and expand your contact base.
It is very important not to perceive each metric separately, but to include them in the overall strategy by systematizing your tasks, lead segments, and communication scenarios.
Collect data, love your subscribers, do not delay automation, and optimize conversion!
At the end, here are a few tips to make your emails more effective:


Subscribe to Dashly newsletter
Join the community of 13,000 pros who get expert insights on marketing, support, and sales in a weekly newsletter


